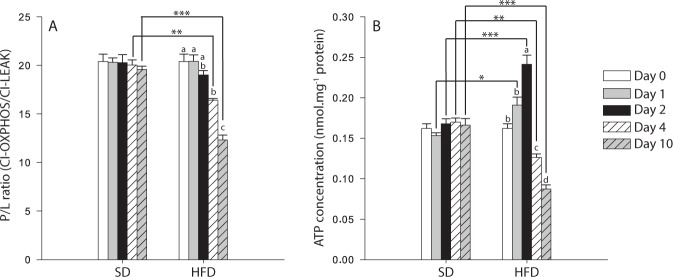
Figure 5.
Mitochondrial coupling and ATP content measured in thorax muscle of Drosophila melanogaster males exposed to either a standard diet (SD) or a high-fat diet (HFD). (A) P/L ratio at the level of complex I (P/L = CI-OXPHOS/CI-LEAK), as an indicator of mitochondrial quality and of mitochondrial coupling (N = 6), (B) ATP content (N = 3). Results are means ± s.e.m for each day of the exposure and for each diet, and have been analyzed using a two-way ANOVA followed by pairwise comparisons of the least-squares means using adjusted P-values (Tukey method). Stars depict significant differences between the SD and the HFD on each day of exposure with: *P < 0.05, **P < 0.01, ***P < 0.001. Dissimilar lowercase letters denote changes between days of exposure to a specific diet, with each different letter(s) representing statistically significant differences (P < 0.05).

