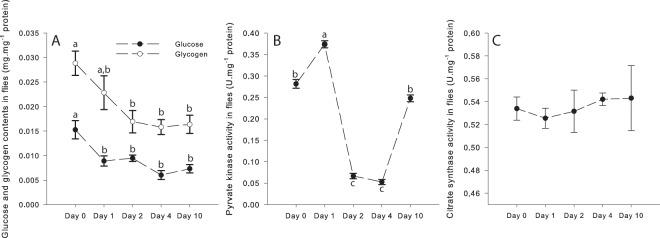
Figure 7.
Effects of the high-fat diet (HFD) on (A) Glucose and Glycogen contents of flies, (B) Pyruvate kinase activity, and (C) Citrate synthase activity. Results are means ± s.e.m for each day of the exposure (N = 4–5 for glucose and glycogen contents; N = 6 for pyruvate kinase and citrate synthase activities) and have been analyzed using a one-way ANOVA followed by pairwise comparisons of the least-squares means using adjusted P-values (Tukey method). Dissimilar lowercase letters denote changes between days of exposure to a specific diet, with each different letter(s) representing statistically significant differences (P < 0.05).

