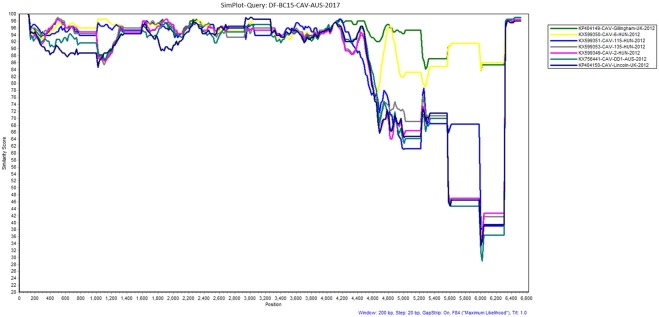
Figure 2.
Similarity plot generated in SimPlot using the canine astrovirus sequence (DF-BC15- CAV-AUS-2017) from the dog samples as the query sequence against seven other reference sequences from NCBI Genbank. Divergence between DF-BC15-CAV-AUS-2017 and each reference sequence over the 6612 nucleotides genome using a 200 nucleotides sliding window at 20 nucleotides intervals and the F84 distance46 model with the maximum likelihood method. Percentage identities at each analysis point were plotted on a line chart. For similarity plot analysis, the y-axis shows the percentage similarity between the parental sequences and the query sequence. Different colors represent a different reference sequence.

