
Figure 2.
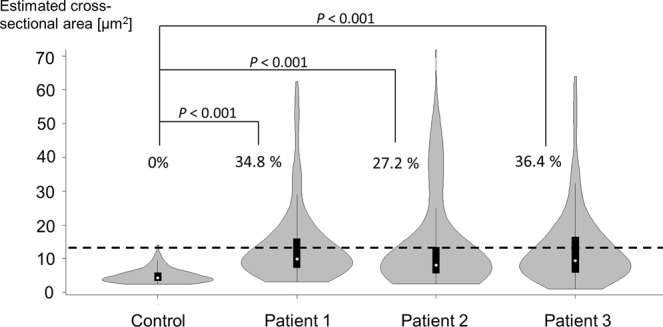
Skewed distribution of platelet size in patients. The vertical axis represents the estimated cross-sectional area [μm2]. The horizontal dotted line represents the cut-off value (12.6 μm2) of the estimated cross-sectional area for macrothrombocytes. Note that the distributions of platelet size were skewed positively (upwards) in patients 1–3. Macrothrombocytes comprised none (1/120) of the platelets in the control, 34.8% (47/135) of the platelets in patient 1, 27.2% (24/88) of the platelets in patient 2, and 36.4% (51/140) of the platelets in patient 3.