
Figure 2.
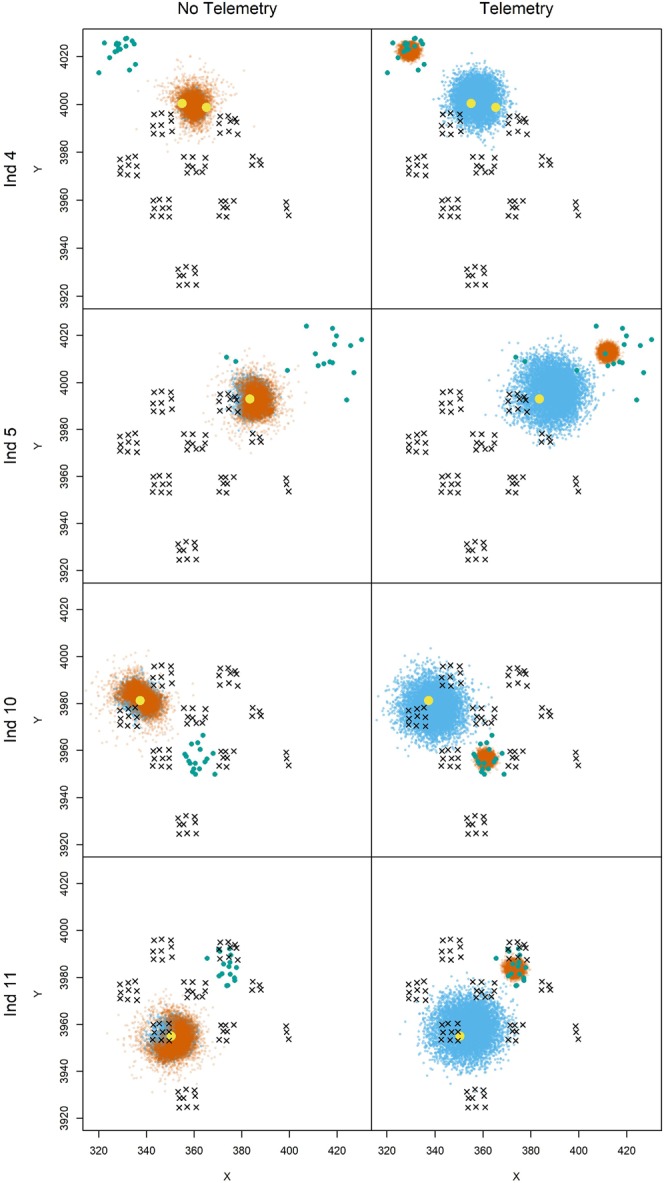
Estimated activity center locations for four marked pumas from generalized spatial mark-resight models that accommodated activity center transiency between marking and resighting processes, and excluded or included telemetry location data from GPS collars. The estimated posterior densities of individual activity centers for the marking and resighting processes are denoted by blue and orange, respectively. The spatial locations where each puma was live-captured, the locations of camera-traps, and thinned telemetry locations from the resighting period are denoted by yellow circles, black × , and green circles, respectively. Image created by B.C.A. with the R statistical software60.