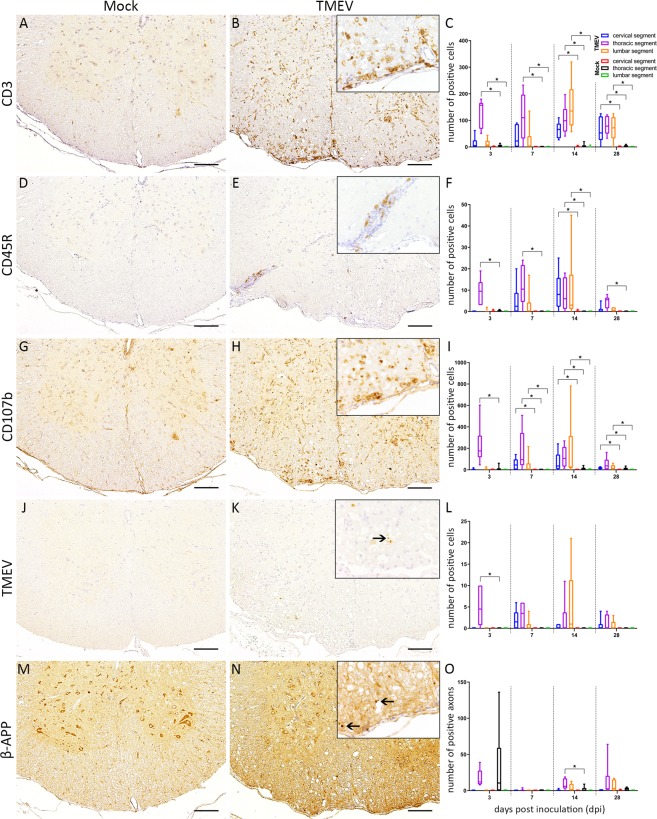
Figure 3.
Immunophenotyping of inflammatory cells within the thoracic spinal cord at 14 days post intraspinal mock (A,D,G,J,M) and TMEV (B,E,H,K,N) injection. Statistical analysis revealed significantly increased numbers of CD3 (T lymphocytes), CD45R (B lymphocytes) and CD107b (microglia/macrophages) positive cells (C,F,I), the presence of virus protein (K, arrow) as well as an accumulation of beta-amyloid-precursor protein (β-APP; N, arrows) in the spinal cord of TMEV-infected animals. The following number of animals was evaluated per group: n = 6–8 at 3 dpi; n = 5–6 at 7 dpi; n = 6–8 at 14 dpi; n = 6 at 28 dpi. Box-and-whisker plots show median and quartiles. Significant differences between the groups as detected by Mann-Whitney U-test are indicated by asterisks (p ≤ 0.05), bars = 100 µm. Inserts in 400x magnification.

