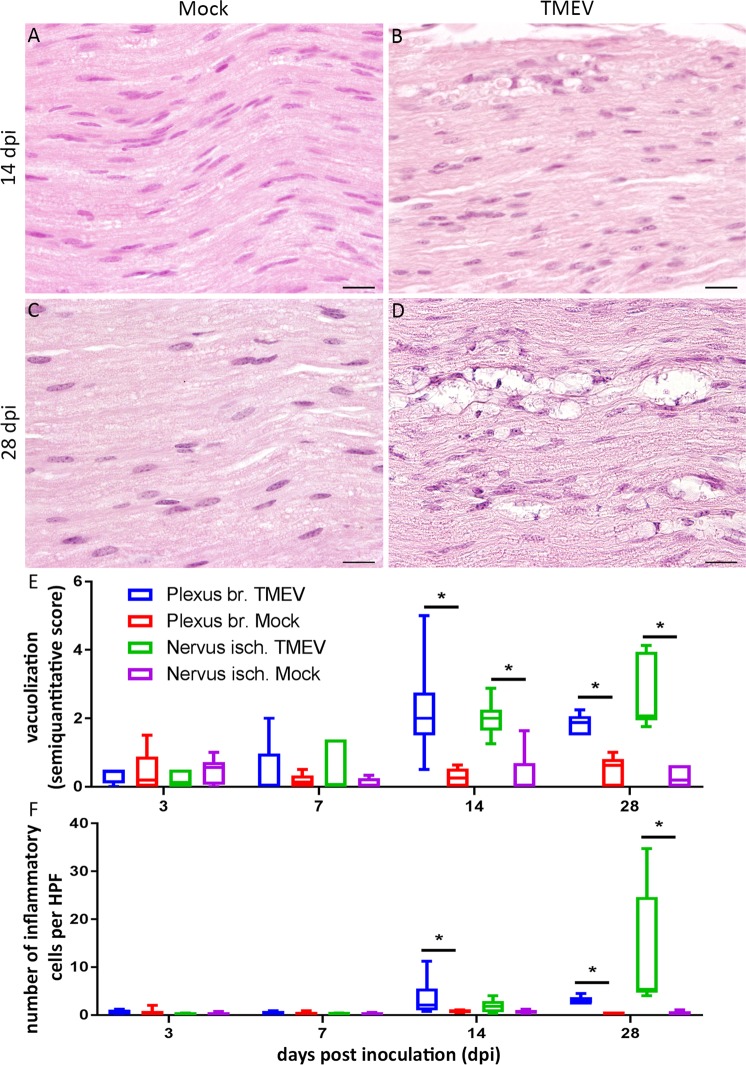
Figure 5.
Investigation of peripheral nerves revealed a vacuolization of nerve fibers as well as an increased cellularity due to infiltration of inflammatory cells at 14 (A,B) and 28 (C,D) days post intraspinal TMEV infection. The number of inflammatory cells is presented as average number per high power field (HPF; E). For quantification of vacuolization, a semiquantitative scale was used (0 = no vacuoles; 1 = ≤3 vacuoles per HPF); 2 = <10% of nerve area per HPF affected, 3 = 10–20% of nerve area per HPF affected; 4 = 20–30% of nerve area per HPF affected; 5 = 30–40% of nerve area per HPF affected; (F). The following number of animals was evaluated per group: n = 6–8 at 3 dpi; n = 5–6 at 7 dpi; n = 6–8 at 14 dpi; n = 6 at 28 dpi. Data are presented as box-and-whisker plots showing median and quartiles. Significant differences between groups as detected by Mann-Whitney U-test were indicated by asterisks (p ≤ 0.05). Bars = 20 µm.

