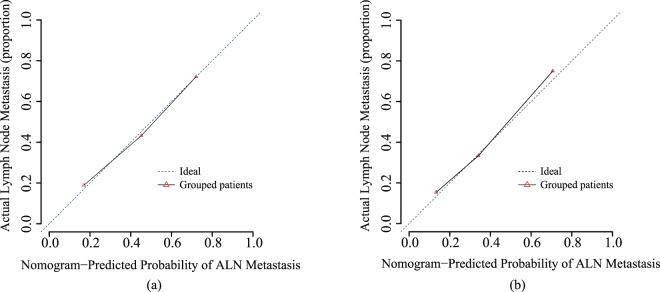
Figure 5.
Calibration curves of the radiomics nomograms generated from the primary (a) and validation cohorts (b). The goodness of fits of predicted probability from radiomics nomograms with the actual outcomes of the ALN metastasis was assessed. The y-axis represents the actual rate of ALN metastasis while the x-axis represents the calculated probability of ALN metastasis. The dashed lines represent the actual diagnosis and the solid line represents the performance of the radiomics nomogram without removed the bias.

