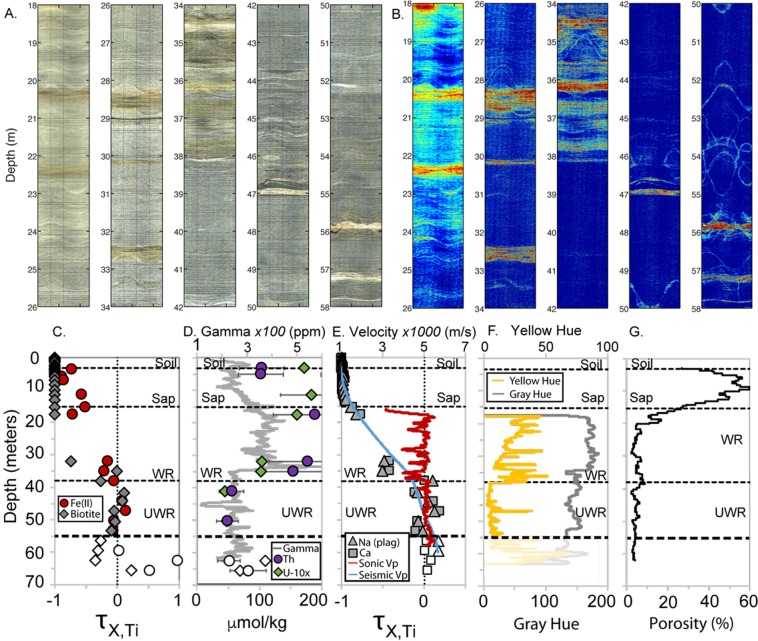
Figure 1.
Downhole borehole images, geochemistry, and geophysics. Optical borehole imager view of the borehole wall (A) and yellow hue, defined as (R + G)/2-B (B). Inclined planar features such as fractures appear as sinusoids on these unrolled 360° images of the borehole wall. Warm colors in (B represent higher levels of yellow and brown; cooler colors represent gray. Above 55 m depth, yellow/brown versus gray hues generally indicate weathered versus unweathered minerals, respectively; below 55 m, a different rock exists and yellow colors do not necessarily indicate weathering. Downhole geochemical and geophysical data demarcate the onset of weathering around 38 m depth (C–G), which corresponds with visual changes in A and B. Interpreted layers in C–G are soil, saprolite (Sap), weathered rock (WR) and unweathered rock or protolith (UWR). Oxidation of the rock is represented by a loss of Fe(II) and alteration of biotite (C). Changes in U, Th and natural gamma (D) demarcate a possible lithological change at 34 m. Slowing seismic and sonic velocities and loss of plagioclase feldspar (Plag), Na and Ca (E) are consistent with a boundary between unweathered and weathered rock around 38 m. Refraction seismic velocity is derived from two lines that cross the borehole13. Fractional mass loss (X = Fe(II), biotite, or plagioclase), τX,Ti, was calculated assuming Ti is immobile during weathering. τ varies from 0 (no mass loss relative to Ti in protolith) to −1 (100% loss). Open symbols on (C,D and E) represent a different lithology below the protolith at 55 m. Below 34 m, the rock is darker (lower grayscale value, F), and less radioactive (natural gamma, D). Measures of borehole wall color with depth (F) (gray hue = gray line; yellow hue = yellow line) show upward increasing yellow hue indicative of weathering (as observed in B). Grayscale and yellow hue are plotted as faint lines below 55 m, where we interpret a different lithology unrelated to the shallow critical zone. Finally, NMR-derived porosity (G) increases at the unweathered rock-weathered rock boundary and again throughout the saprolite as seismic velocities decrease and chemical depletion increases.

