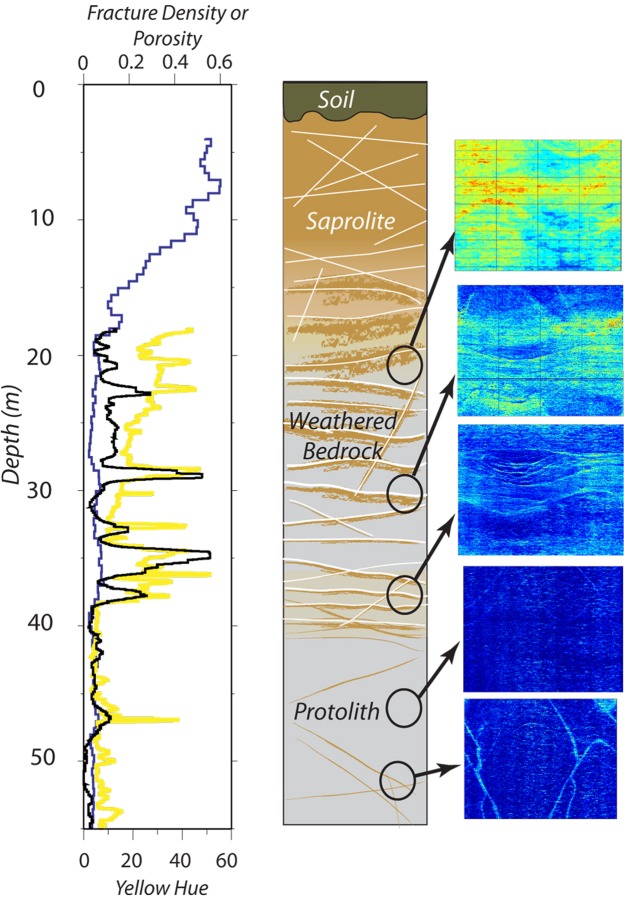
Figure 2.
Water and fractures in the critical zone. Depth plots of water content (blue line) from the NMR log (i.e., total porosity below the water table observed at about 4 m, fracture density (black line), and yellow hue (yellow line). Conceptual model of the Calhoun borehole rock (Center) shows upward increase in fracture density and weathering (brown color). Zooms of yellow hue from OBI at several levels of the well (Right) highlight the association of weathering (warm colors) with fractures (sinusoidal shapes) at all depths, and overall upward increase in weathering intensity from 38 m to 18 m depth.

