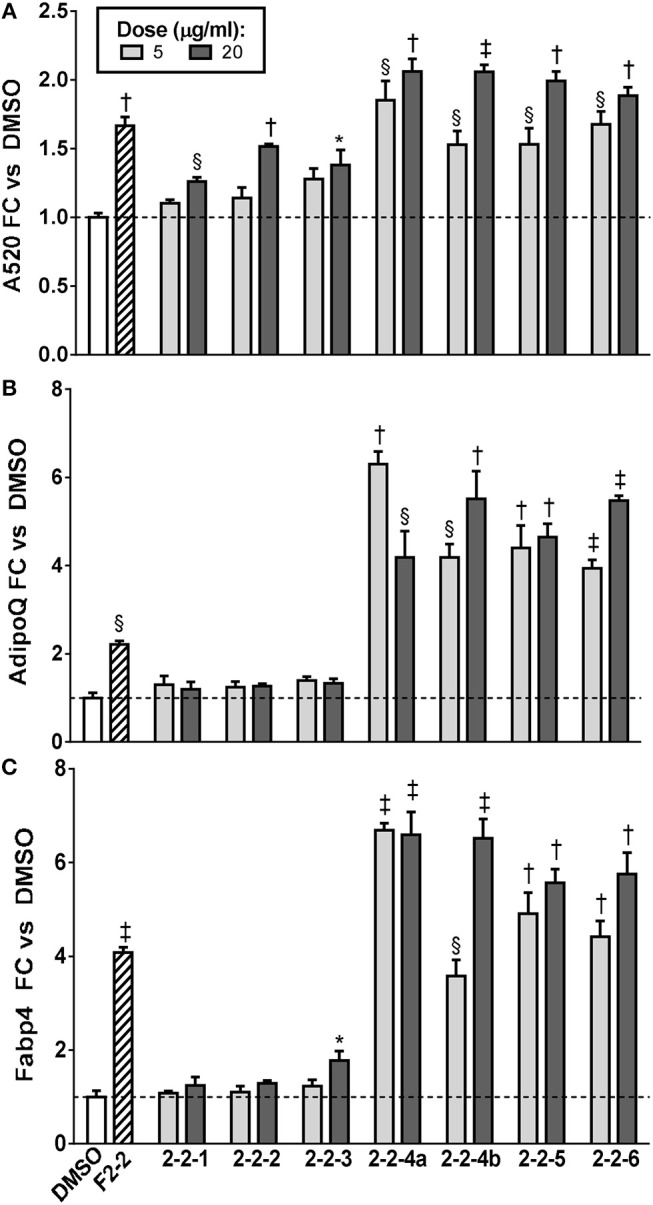
Figure 8.

Adipogenesis in 3T3-L1 cells is enhanced by subfractions of EA-F2-2. Cells were induced to differentiate using half-strength MDI cocktail containing DMSO vehicle, 10 μg/ml of F2-2, or 5 or 20 μg/ml of each EA-F2 subfraction. (A) 4 days after induction, cells were fixed and stained with Oil Red O. Staining was quantitated by measuring absorbance in isopropanol eluates. (B) 3 days after induction, cells were harvested for RNA purification and reverse transcription; relative expression of AdipoQ and Fabp4 were assayed by qPCR. All data expressed as fold-change vs. DMSO vehicle controls. *p < 0.05, §p < 0.01,†p < 0.001, ‡p < 0.0001 vs. DMSO controls. Images of the stained plates are shown in Figure S4.
