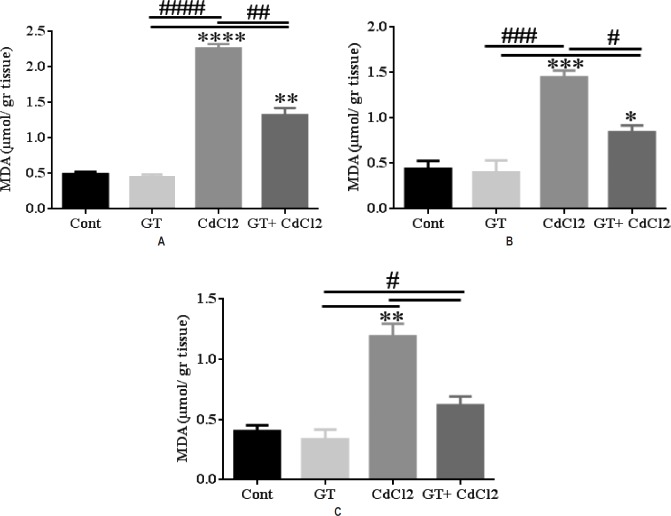
Figure 1:
MDA level in testes tissue. MDA at (A) 13th, (B) 25th, and (C) 49th. Results showed a significant increase in the MDA 13, 25 and 49 days in the CdCl2 compared to Cont., GT and GT plus CdCl2. CdCl2 increased lipid peroxidation compared to other groups. Results are represented as Mean±SEM. Statistical significance is indicated by **p < 0.01, ****p < 0.0001, #p < 0.05, ##p < 0.01, and ####p < 0.0001. *corresponds to the comparisons between each group versus the control group. # corresponds to the internal comparisons within the various groups. Data for each time point was repeated for n= 6 times.

