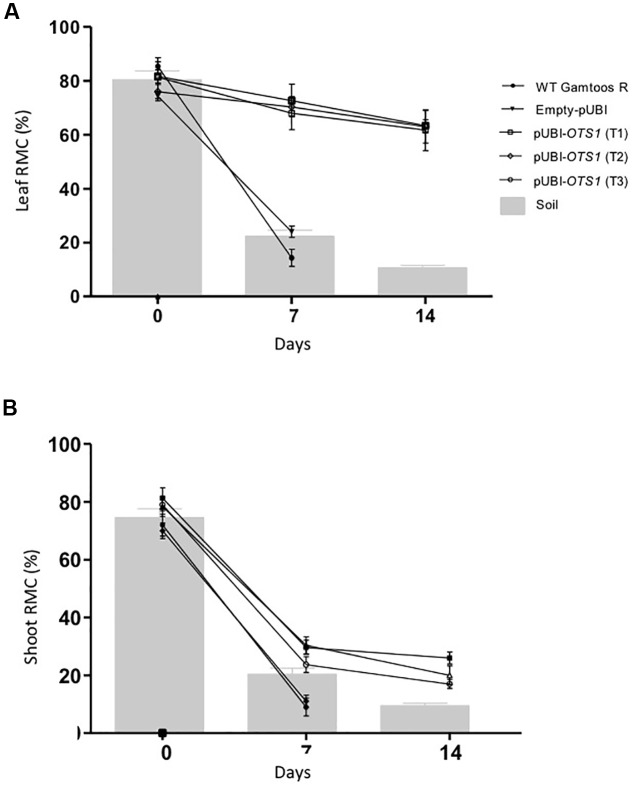
FIGURE 2.
Comparative analysis of relative moisture content (RMC) measured in the leaves (A), and shoots (B) prior to and after induction of water stress. The gravimetric readings of the soil are superimposed against the RMC. Indicated are the RMC of untransformed (WT Gamtoos-R) and wheat transformed with pUBI-OTS1 or empty vector (pUBI), emphasizing how they maintain RMC under deficient soil moisture. Error bars indicate SD (n = 9) and significance was set at p = 0.05.

