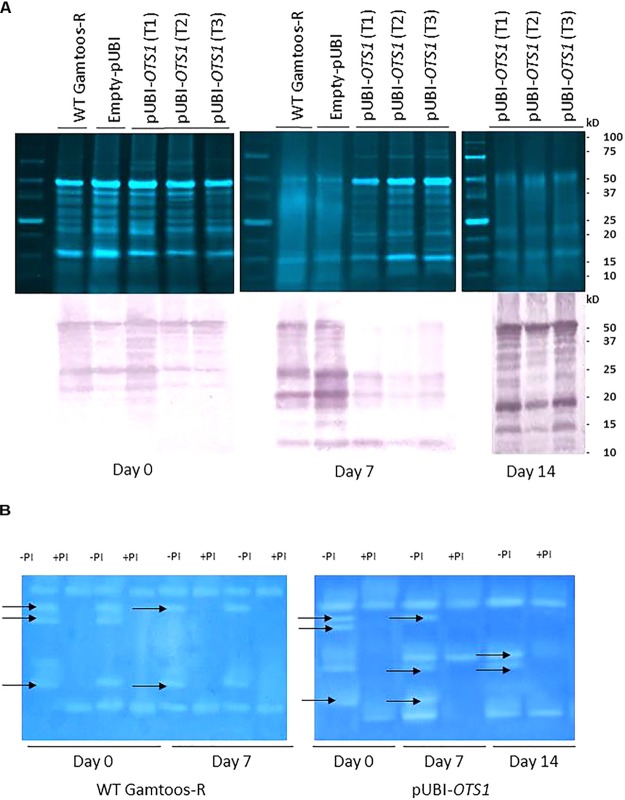
FIGURE 5.
(A) Top: Crude protein separated on a 12.5% SDS-PAGE from untransformed (WT Gamtoos-R) and transformed pUBI-OTS1 wheat prior to (day 0) and after exposure to water stress (day 7 and 14). All lanes were loaded with 20 μg total protein. Bottom: Untransformed (WT Gamtoos-R) and wheat transformed with pUBI-OTS1 or empty vector (pUBI) prior to (day 0) and after exposure (day 7 and 14) to water stress, probed with anti-SUMO IgG. All lanes were loaded with 20 μg total protein. Blots were probed with a dilution of 1:10 000 dilution of monoclonal IgG against SUMO1. Images were cropped for presentation purposes. T1–T3 represents three independent transgenic events. (B) Gradient Zymograms depicting proteolytic activity of untransformed and transgenic pUBI-OTS1 prior to (day 0) and after exposure to water stress (day 7 and 14). Zymograms (gradient 5–15%) were casted and in all cases 35 μg protein was loaded. Inclusion of an incubation step with 0.1 mM Cystein Protease inhibitor (E-64) performed at pH 7, enabled for the identification of cysteine proteases. Lanes with +PI refers to treatment with protease inhibitor; whereas –PI refers to no inhibitor treatment. Arrows indicated bands that were removed after treatment with the 0.1 mM Cystein Protease inhibitor (E-64). The presented data is representative of two independent experiments. Images were cropped for presentation purposes, and the contrast was adjusted (10%).

