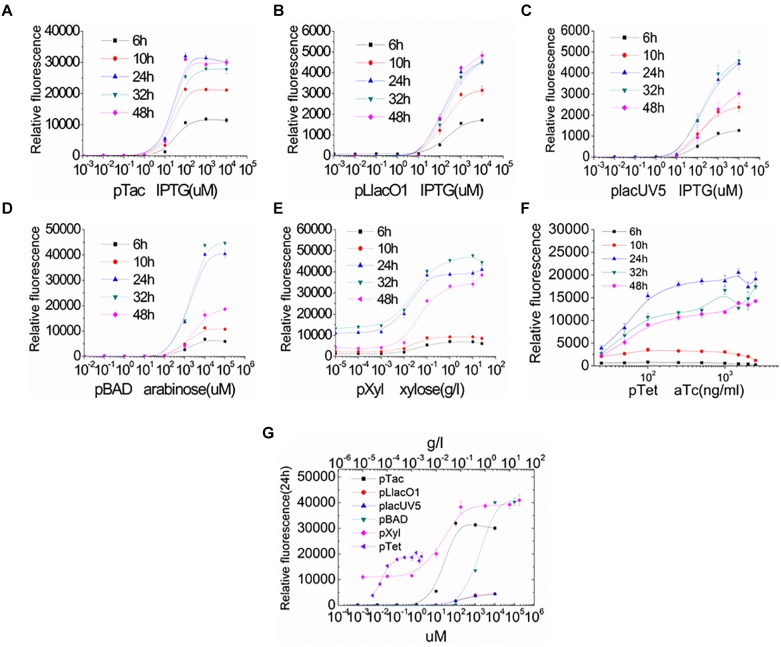
FIGURE 3.
Characterization of the inducible promoters by regulating inducer concentration and induction time in S. oneidensis MR-1. (A–F) GFP expression under the control of inducible promoters was measured at 6, 10, 24, 32, and 48 h after induction with a series of different inducer concentrations. (A–C) IPTG-inducible pTac, pLlacO1, and placUV5; (D) arabinose-inducible pBAD; (E) xylose-inducible pXyl; (F) aTc-inducible pTet). (G) GFP expression was measured at 24 h after induction with different inducer concentrations. The error bars (mean ± SD) were derived from triplicate experiments for each strain.

