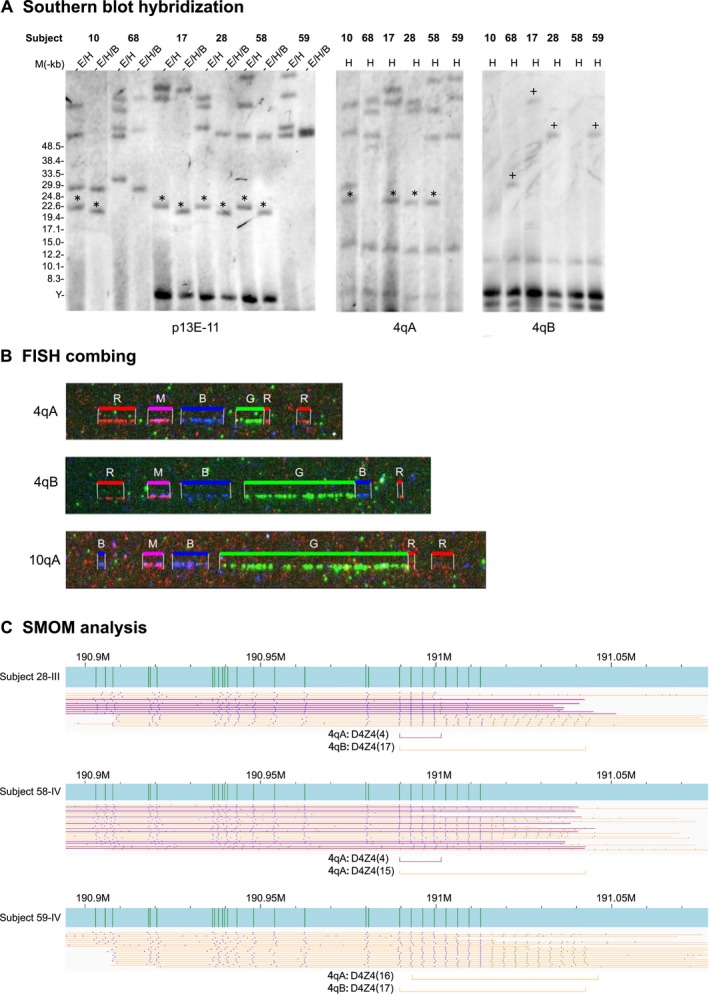
Figure 2.

Molecular diagnosis of FSHD1. (a) Southern blot hybridization of selected family members with FSHD1. Membrane‐bound EcoRI/HindIII (E/H), EcoRI/HindIII/BlnI (E/H/B), and HindIII (H) digested genomic DNA from affected and normal family members were hybridized to p13E‐11 (4q35 and 10q26), 4qA, and 4qB labeled probes. 4qA (*) and 4qB (+) fragments. (b) FISH analysis of family member 28‐III (FSHD1). Green signals represent D4Z4 repeat numbers. (c) SMOM analysis of FSHD1 family members. BssSI maps (vertical green bars) of 4qA (purple) and 4qB (orange) alleles for family members 28‐III and 58‐IV (FSHD1) and 59‐IV (normal). The position and number (n) of D4Z4 repeats for each allele are indicated by horizontal purple and orange bars
