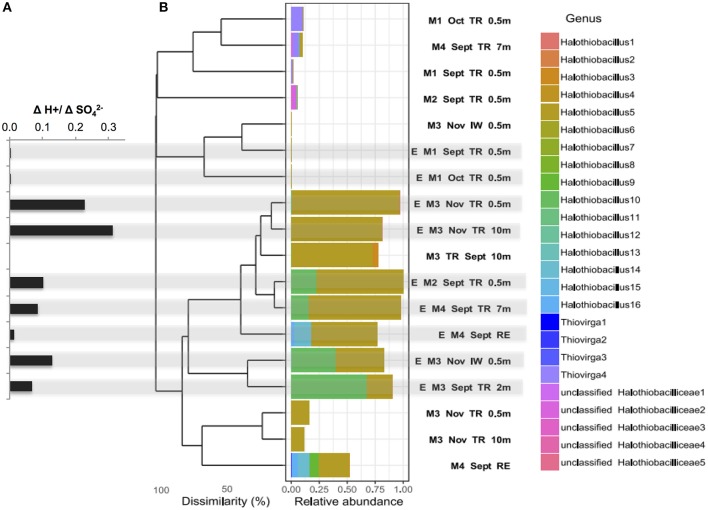
Figure 3.
(A) Net acid generation relative to net sulfate generated ([H+:[S]) (bold stars) for each SoxBac enrichment and (B) Bray-Curtis dissimilarity based hierarchical clustering of samples for all the single absolute sequences clustered at genus level for the family Halothiobacillaceae. Sequences were obtained by Illumina sequencing of 16S rRNA gene amplicons for the different mines, mining environments and its enrichments. Halothiobacillaceae relative abundance is calculated per sample and relative to the whole microbial community. Gray shading indicates the ΔH+:ΔS- ratios that correspond to each enrichment SoxBac community.

