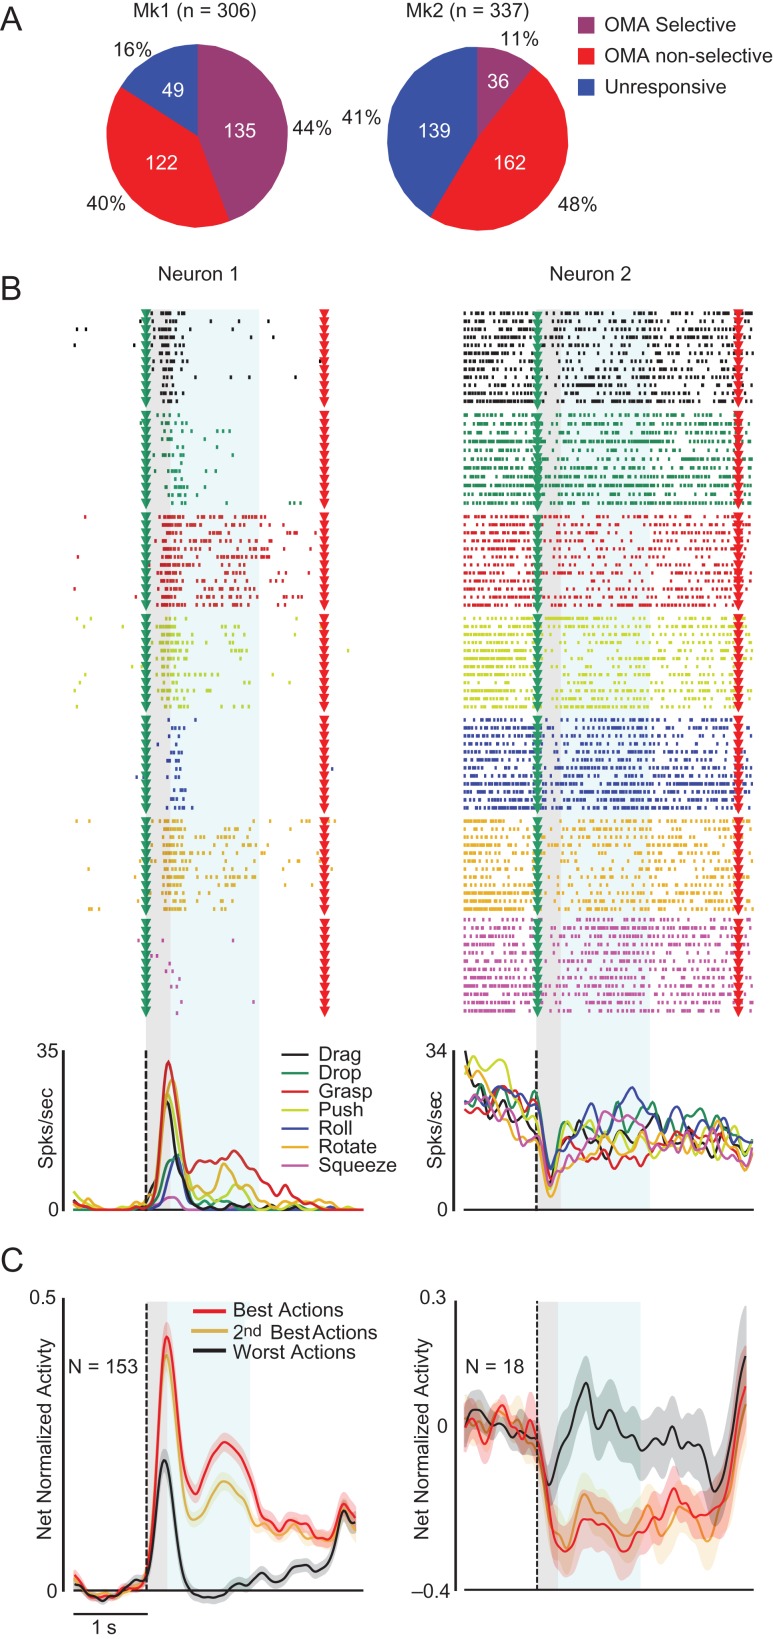
Figure 2.
Single neuron examples, population activity and tuning properties of AIP units in the OT. (A) Percentage of OMA-selective, -nonselective, and –unresponsive units in each monkey. (B) Examples of facilitation (Neuron 1) and suppression (Neuron 2) OMA-selective neurons. Each neuron’s raster and peri-stimulus response is aligned to the video presentation (green triangles and dashed lines). Red triangles, reward delivery. (C) Time course of the net normalized population activity (including single- and multiunits) of OMA-selective facilitated (Left) and suppressed (right) units. The shading area around each line indicates 1 standard error, gray and light-blue shaded areas superimposed on each plot represent epochs 1 and 2 used for statistical analysis.

