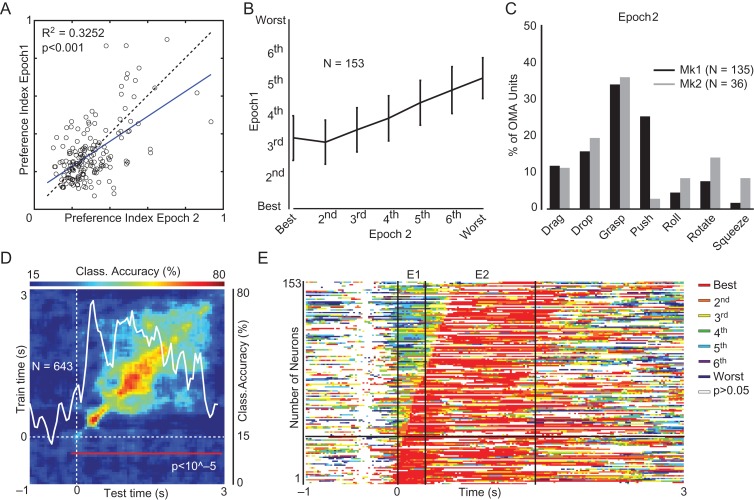
Figure 3.
Temporal dynamic of OMA processing in AIP. (A) Regression plot of preference index (PI) values calculated on OMA-selective unit activity during Epoch 1 and 2. See also Figure S2D. (B) Cross-validation of the ranking of all OMA exemplars performed with the average activity (±1 standard error) during Epoch 1 as a function of the same ranking performed with the average activity during Epoch 2 (Kruskal–Wallis, χ2 = 139.34, P < 0.001). (C) Percentage of units selective for each OMA exemplar in each monkey during Epoch 2. (D) Classification accuracy of OMA exemplars as a function of test and training time. The superimposed white line represents the classification accuracy of the population along the diagonal (scale on the right). The red line in the lower part of the plot indicates the period of time during which the decoding accuracy is significantly above chance level (see Materials and Methods). (E) Cross-validation of the best OMA exemplar (rank = 1) calculated with the activity during Epoch 2 (E2) as a function of time during the entire action unfolding period (bin width 300 ms, step 20 ms). For each bin the color code (see inset) represents the local rank of the OMA ranking 1 in Epoch 2. Bins in which neural activity was not significantly different from baseline (sliding window ANOVA, bin width 300 ms, step 20 ms, P > 0.5 uncorrected) have been blanked out (E1 = Epoch 1).

