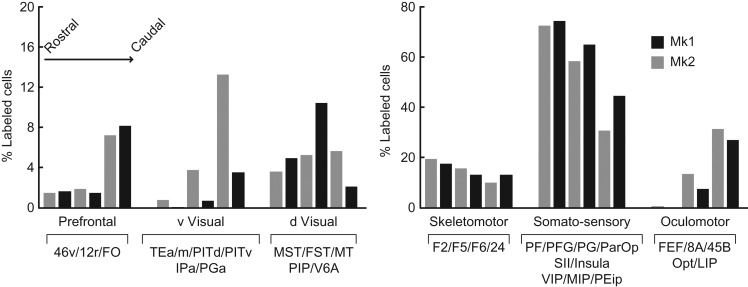
Figure 7.
Rostrocaudal gradients in AIP anatomical connectivity. Each bar represents the percentage of labeled cells observed in the various functional territories. Each territory is defined based on functional similarities of the labeled areas. The areas included in each cluster are listed under the histograms. The bars in each cluster are arranged in a rostral to caudal fashion relative to the location of the injection sites. Acronyms as in Figures 1 and 6.

