Figure 6.
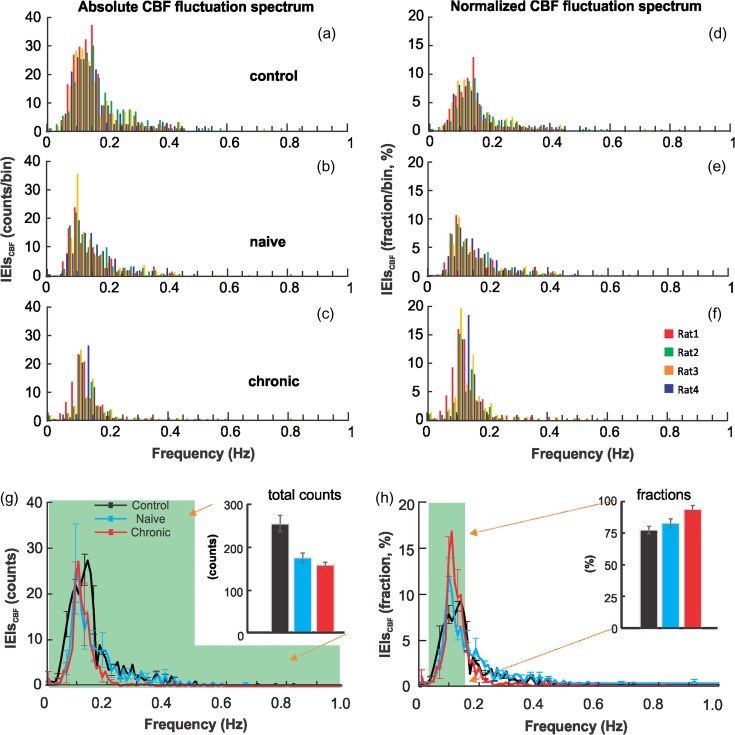
(a–c) Absolute CBF fluctuation spectra quantified as oscillations counts for the control, naïve and chronic groups. In each group, the CBF fluctuation spectra from individual animals (n = 4) were overlapped in 4 different colors. (d–f) Relative CBF fluctuation spectra for control, naïve and chronic groups, which were normalized by the total CBF oscillations counts and presented in percentage. (g) Bar diagram compares the total CBF oscillations counts <1 Hz (shaded area) for the 3 groups, 259.0 ± 17.1 (control), 177.2 ± 10.72 (naïve), and 164.6 ± 4.92 (chronic). (h) Bar diagram compares the normalized CBF fluctuation in the unit of percentage within 0.03–0.15 Hz (shaded area) for the 3 groups, 75.30 ± 2.9% (control), 83.4 ± 2.1% (naïve), and 94.4 ± 1.3% (chronic). Data from individual animals is illustrated in Supplemental Figure S3.

