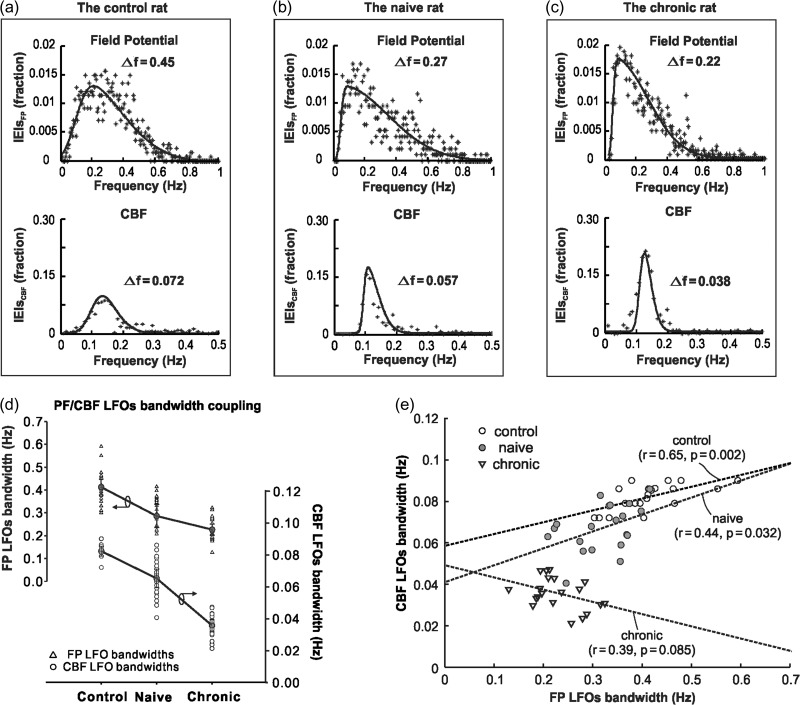
Figure 7.
(a–c) Representative FP and CBF LFOs distributions from individual rats grouped by different experiment groups. Raw spectra are plotted in scattered spots (crosses) and overlapped by their skewed-Gaussian fitted profiles (solid lines). (d) The FP LFOs bandwidths and CBF LFOs bandwidths from each animal (control, naïve and chronic) at different time segments (baseline: −10 to 0, 10–20, 20–30, and 30–40 min). (e) Linear regression between the FP LFO bandwidths and the CBF LFOs bandwidths for each group. The FP-CBF bandwidth pairs (m = 20 for each group) were sampled at baseline (−10 to 0 min) and at 10–20, 20–30, and 30–40 min following saline or cocaine for each animal (n = 5) within each group.

