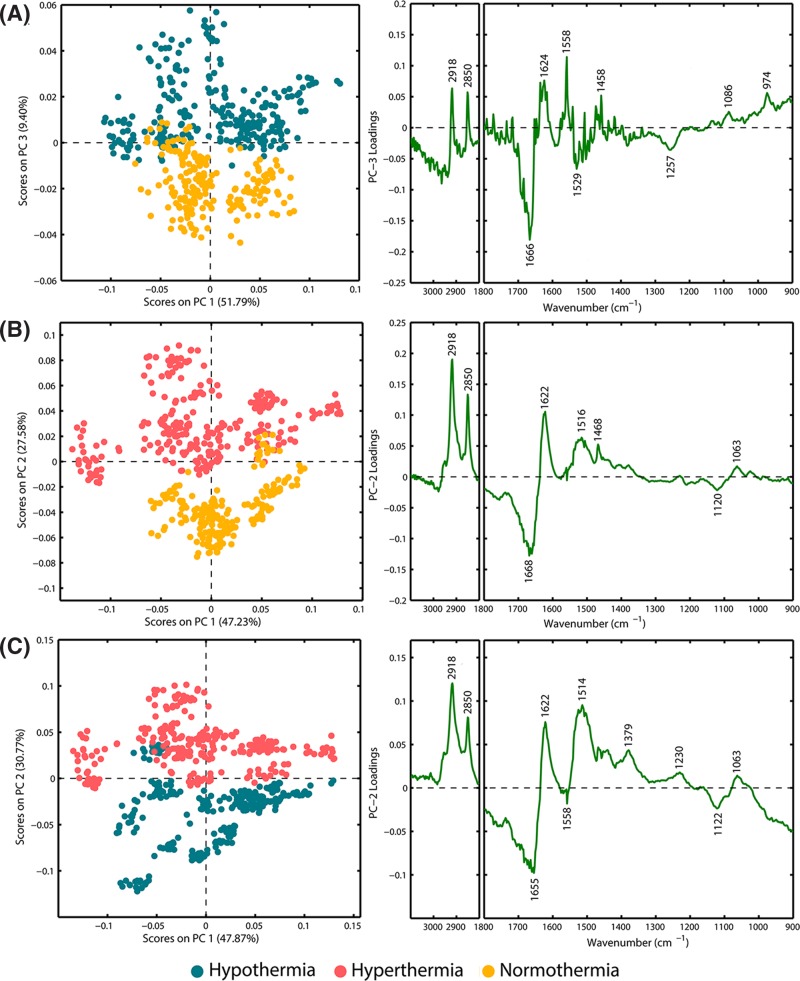
Figure 3. PCA score and loading plots.
(A) PCA results for spectra from fatal hypothermia and normothermia hypothalamus tissues: scores plot (PC-1 vs. PC-3) and loading corresponding to PC-3); (B) PCA results for spectra from fatal hyperthermic and normothermic hypothalamus tissues: scores plot (PC-1 vs. PC-2) and loading corresponding to PC-2); (C) PCA results for spectra from fatal hypothermic and hyperthermic hypothalamus tissues: scores plot (PC-1 vs. PC-2) and loading corresponding to PC-2).

