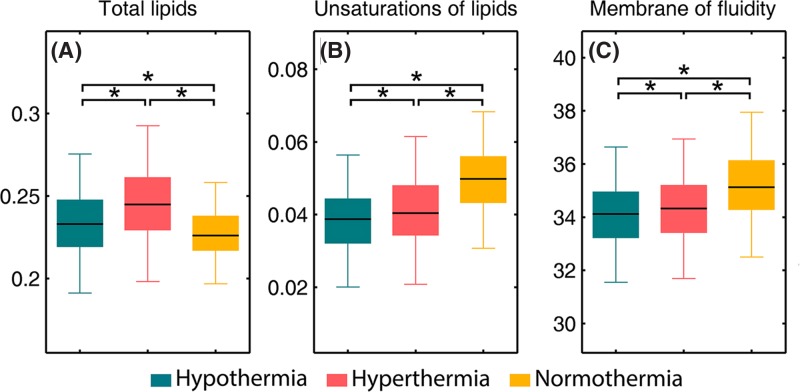
Figure 5. Selected biomarkers found in FTIR spectra.
(A) total lipids (I2850 + I2920), (B) unsaturation of lipids (I3012 / (I2850 + I2920)), (C) membrane fluidity (the bandwidth values of CH2 asymmetric stretching band near 2920 cm−1). An asterisk means that there is a significant difference (P<0.05).

