. 2019 Feb 25;38(6):e100024. doi: 10.15252/embj.2018100024

Figure 2. NEDP1 knockout results in the accumulation of poly‐NEDD8.

Figure 2

  1. (Left) Western blot analysis of large‐scale HALO‐NEDP1 pulldowns from HEK 293 NEDP1 KO lysates. (Right) Diagram of mass spectrometry sample preparation.
  2. Table of the number of spectral counts from proteins with identified diGly‐modified peptides, following pulldown by HALO‐NEDP1 CA or the HALO‐NEDP1 DAGC reduced binder control. NEDD8 is the protein most highly modified by NEDD8.
  3. Scatter plot of proteins identified by mass spectrometry analysis identifies NEDD8 and components of the NEDD8 conjugation pathway as being the most abundant proteins in HEK 293 NEDP1 KO lysates following NEDP1‐CA pulldown. iBAQ analysis of proteins identified in (A) is plotted as the log2 value of the enrichment ratio (mass spectrometry intensity of the HALO‐NEDP1 CA pulldown over HALO‐NEDP1 DAGC pulldown) versus the log10 value of the iBAQ intensity from the HALO‐NEDP1 CA pulldown. Blue markers indicate known components of the NEDD8 pathway, and red markers indicate proteins that have been identified as substrates of PARP‐1 in the database of ADP‐ribosylated proteins, ADPriboDB (Vivelo et al, 2017).
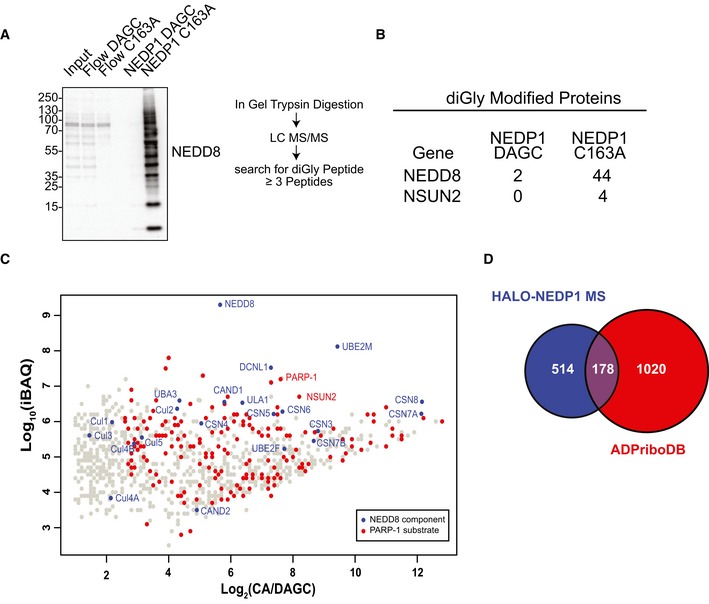
  4. Venn diagram of the proteins enriched by at least sixfold following HALO‐NEDP1 CA pulldown compared with proteins identified as PARP‐1 substrates in the database of ADP‐ribosylated proteins, ADPriboDB (Vivelo et al, 2017).