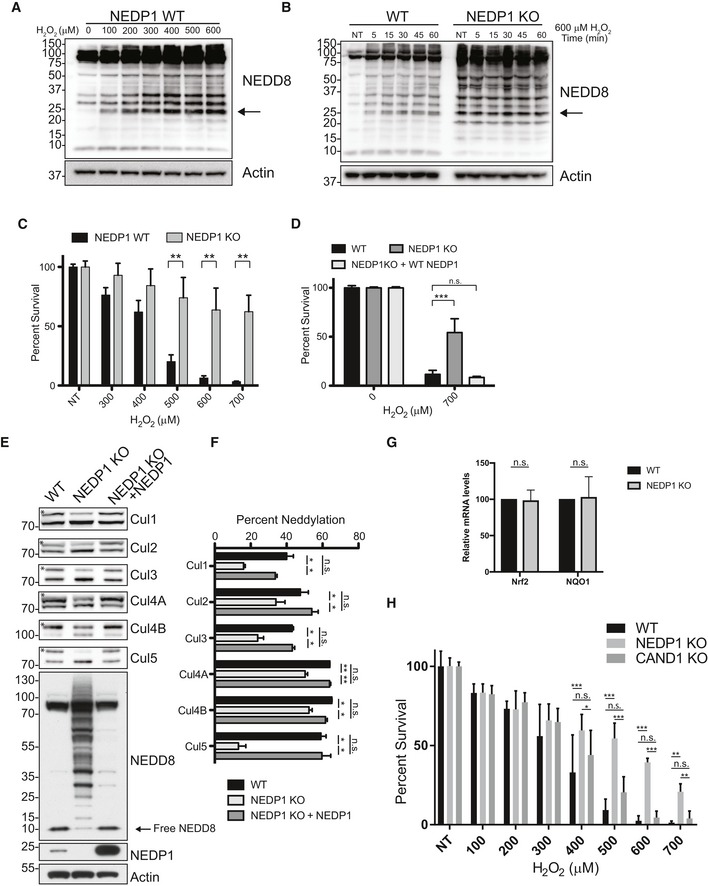
Non‐cullin neddylated species accumulate after oxidative stress in WT U2OS cells with the most highly induced species detected at 25 kDa (as indicated by the arrow). WT U2OS cells were treated with the indicated concentration of H2O2 for 30 min and then lysed in LDS sample loading buffer and processed for Western blot analysis.
(Left) The 25‐kDa neddylated species induced by oxidative stress increases with time in WT U2OS cells. U2OS WT or NEDP1 KO cells were treated with 600 μM H2O2 for the indicated time and then lysed in LDS sample loading buffer and processed for Western blot analysis. (Right) The same 25 kDa NEDD8 species, which is strongly induced in WT cells, is present in untreated NEDP1 KO cells and does not further increase after oxidative stress induced by H2O2 (as indicated by the arrow).
U2OS NEDP1 KO cells are resistant to the PARP‐1 inducer, H2O2. WT and NEDP1 U2OS cells were plated in 96‐well plates and after 24 h were treated with the indicated concentration of H2O2. They were assessed for viability 24 h later by the CellTiter‐Glo assay. Graphs represent the mean ± SEM of the percent survival compared to untreated cells. Two‐way ANOVA with Bonferroni post hoc test: n = 3, **P < 0.0021.
NEDP1 KO cells are re‐sensitized to H2O2, following re‐expression of NEDP1 by transient transfection. U2OS cells were plated in 96‐well plates and reversed transfected with NEDP1 or an empty vector. Forty hours after plating, cells were challenged with the indicated amount of H2O2 and cell viability was assessed 24 h later by the CellTiter‐Glo assay. Graphs represent the mean ± SEM of the percent survival compared to untreated cells. Two‐way ANOVA with Bonferroni post hoc test: n = 3, ***P < 0.001
Neddylation of cullins is decreased in NEDP1 KO cells and is rescued by re‐expression of NEDP1 by transient transfection. Western blot analysis from HEK 293 WT, NEDP1 KO cells and NEDP1 KO cells rescued with transient transfection of NEDP1 reveals that upon NEDP1 re‐expression, the intensity of the NEDD8 reactive bands is reduced, and the levels of free NEDD8 are increased. NEDP1 re‐expression also increased the neddylation of each Cullin. The neddylated band of each Cullin is denoted with a star.
Quantification and graph of the mean ± SEM of the percentage neddylation of each Cullin in (E). One‐way ANOVA with Bonferroni post hoc test: n = 3, *P < 0.05, **P < 0.01, n.s. denotes not statistically significant.
Deletion of Nedp1 does not lead to induction Nrf2 response genes. RNA was harvested from WT and NEDP1 KO U2OS cells, reversed transcribed to cDNA, and analysed by qPCR for Nrf2 and NQO1 expression. Graph represents the mean ± SEM. One sample t‐test: n = 4, n.s. denotes not statistically significant.
Deletion of Nedp1 but not of Cand1 in HEK 293 cells results in resistance to cell death from H2O2. WT, NEDP1 KO and CAND1 KO cells were plated in 96‐well plates and treated with the indicated amount of H2O2. Twenty‐four hours after treatment, cell viability was measured using the CellTiter‐Glo assay. Graphs represent the mean ± SEM of the percent survival compared to untreated cells. Two‐way ANOVA with Bonferroni post hoc test: n = 3, *P < 0.033, **P < 0.0021, ***P < 0.001, n.s. denotes not statistically significant.

