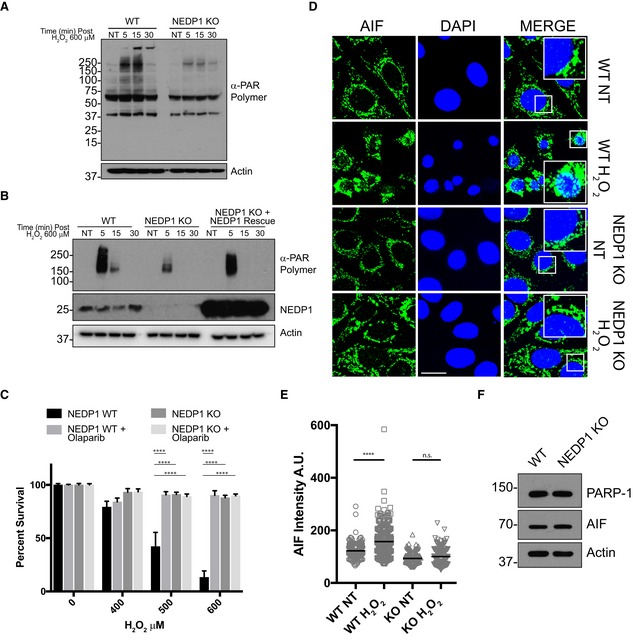
PARP‐1 activity is reduced in NEDP1 KO cells. Western blot analysis of whole‐cell lysates from WT and NEDP1 KO U2OS cells after treatment with 600 μM H2O2 for the indicated amount of time. PAR polymer generation is induced in WT cells after H2O2 treatment, but induction is reduced in NEDP1 KO cells.
PARP‐1 activity is rescued by re‐expression of NEDP1 in NEDP1 KO cells. Western blot analysis of whole‐cell lysates from WT and NEDP1 KO U2OS cells transfected with the indicated constructs. Seventy‐two hours after transfection, cells were treated with the indicated amount of H2O2 and processed for Western blot analysis. PAR polymer generation is reduced in NEDP1 KO cells but can be rescued by the transient re‐expression of NEDP1.
PARP‐1 inhibitor olaparib protects WT cells from H2O2 treatment to the same extent as NEDP1 KO. U2OS cells were plated in 96‐well plates and 24 h later pre‐treated with olaparib (10 μM) for 1 h before treatment with the indicated concentration of H2O2. Twenty‐four hours later, cell viability was measured using the CellTiter‐Glo assay. NEDP1 deletion protects cells from H2O2 treatment to the same extent as PARP‐1 inhibition in WT cells. Olaparib does not provide additional protection to NEDP1 cells from H2O2 treatment. Graphs represent the mean ± SEM of the percent survival compared to untreated cells. Two‐way ANOVA with Bonferroni post hoc test: n = 3, ****P < 0.0001.
AIF translocation to the nucleus is impaired in NEDP1 KO cells. WT and NEDP1 KO cells were plated on coverslips and 24 h later were treated with H2O2 (600 μM) for the indicated amount of time and then processed for immunofluorescence analysis using α‐AIF antibodies and DAPI staining. PARP‐1‐dependent cell death is induced in WT U2OS cells, as indicated by translocation of AIF from the mitochondria to the nucleus (scale bar 10 μm).
Total nuclear AIF intensity from (D) was measured with ImageJ and plotted as a vertical scatter plot with the group mean intensity indicated with a black bar. AIF has translocated to the nucleus after WT cells were exposed to H2O2 but not in NEDP1 KO cells. Kruskal–Wallis test with Dunn's multiple comparison post hoc test: n = 3, ****P < 0.0001, n.s. denotes not statistically significant.
NEDP1 KO cells express normal levels of PARP‐1 and AIF. Western blot analysis of whole‐cell lysates from WT and NEDP1 KO U2OS cells shows that the proteins necessary for the induction of PARP‐1‐dependent cell death are present at equal levels in both cell lines.

