
Figure 3.
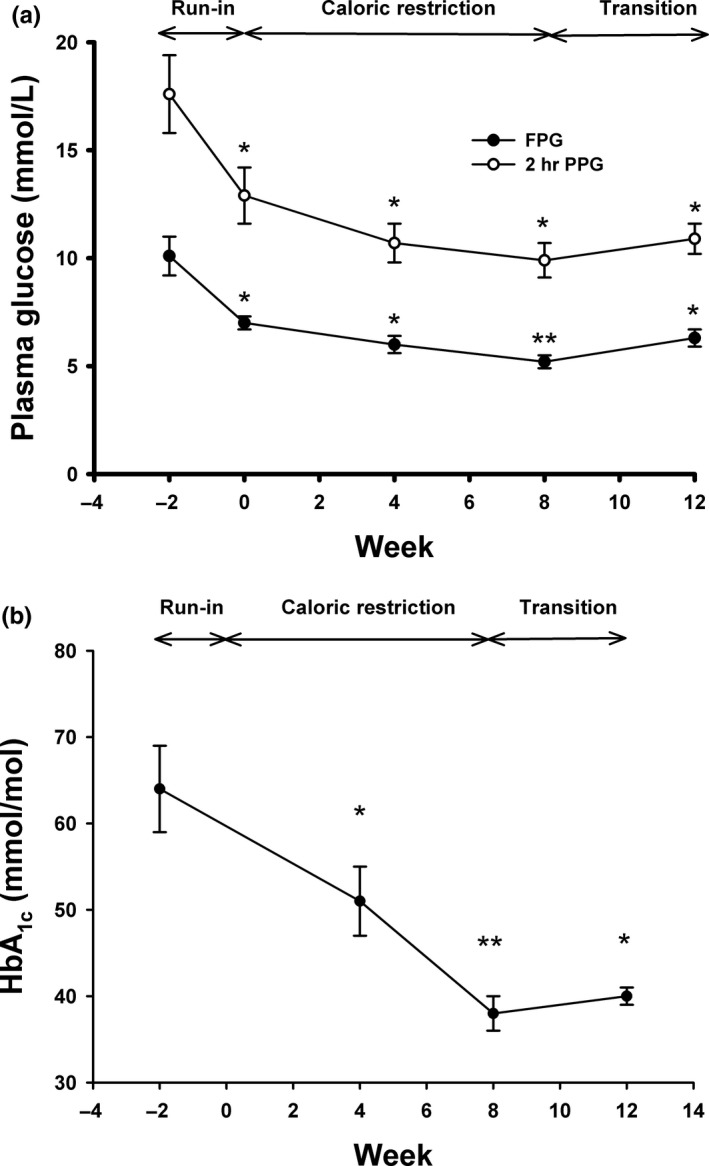
(a) Changes in fasting plasma glucose (FPG), 2‐hr plasma glucose after an OGTT (PPG), and (b) HbA1c during the study periods. (a) Fasting plasma glucose (closed circles) and 2‐hr plasma glucose after an OGTT (open circles) were measured at weeks −2, 0, 4, 8, and 12. (b) HbA1c was determined at weeks −2, 0, 4, 8, and 12. *: p < 0.01, **: p < 0.001 compared to values at week −2