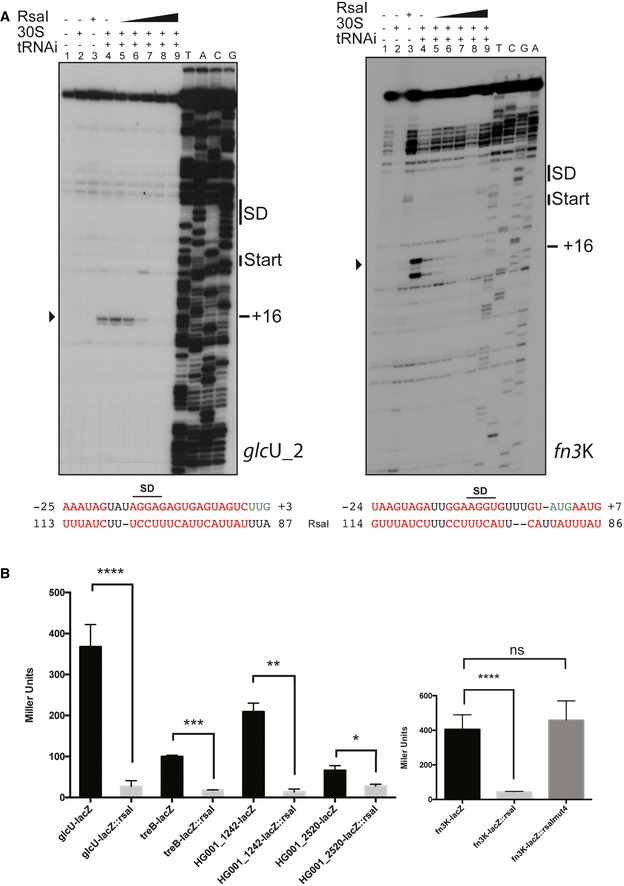
Figure 3. RsaI inhibits glcU_2 and fn3K mRNA translation.

- Toe‐print assays showing the effect of RsaI on the formation of the ribosomal initiation complex of glcU_2 and fn3K mRNAs, respectively. Lane 1: incubation control of mRNA alone; lane 2: incubation control of mRNA with 30S subunits; lane 3: incubation control of mRNA with RsaI; lane 4: formation of the ribosomal initiation complex containing mRNA, 30S, and the initiator tRNAfMet (tRNAi); lanes 5–9: formation of the initiation complex in the presence of increasing concentrations of RsaI, respectively: 50 nM (lane 5), 100 nM (lane 6), 150 nM (lane 7), 300 nM (lane 8), and 400 nM (lane 9). Lanes T, A, C, G: sequencing ladders. The Shine and Dalgarno (SD) sequence, the start site of translation (START), and the toe‐printing signals (+16) are indicated. At the bottom of the gels are shown the predicted interactions between RsaI and its targets. Translation start codons are in green, and the Shine and Dalgarno (SD) sequence is underlined, and the arrowheads depict the toe‐printing signals.
- The β‐galactosidase activity (Miller Units) has been measured from various fusions expressed from a plasmid which also carries rsaI gene under its own promoter: PrpoB::glcU::lacZ::rsaI, PrpoB::fn3K::lacZ::rsaI, PrpoB::treB::lacZ::rsaI, PrpoB::HG001_1242::lacZ::rsaI, and PrpoB::HG001_2520::lacZ::rsaI expressed in the mutant strain HG001‐ΔrsaI. The same constructs were made in the absence of rsaI gene. For the fn3K‐lacZ fusion, we also used an additional construct PrpoB::fn3K::lacZ::rsaImut4 expressing both the fusion FN3K‐LacZ protein and RsaI mut4. The β‐galactosidase activity was normalized for bacterial density, and the results represented the mean of four independent experiments. The error bars are standard deviations, and the statistical significance was determined using the Student's t‐test. *P < 0.05, **P < 0.005, ***P < 0.0005, ****P < 0.0001, ns is for not significant.
Source data are available online for this figure.
