Figure 9.

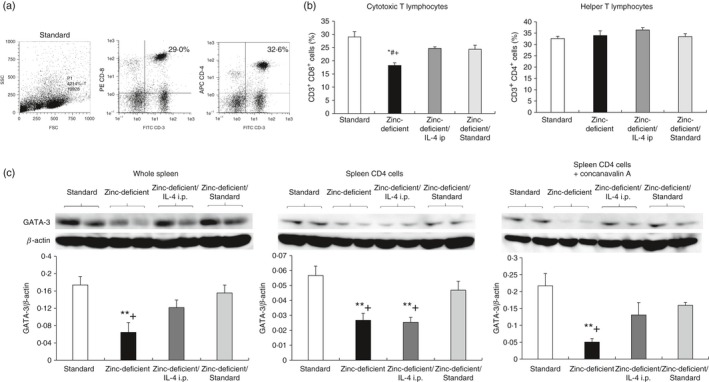
Populations of CD3+, CD4+, and CD8+ cells, and relative GATA‐3 expression in spleens of rats on a standard diet and zinc‐deficient diet and injected with either saline (zinc‐deficient) or IL‐4 (zinc‐deficient/IL‐4 i.p.), or subsequently switched to a standard diet (zinc‐deficient/standard). (a) Flow cytometry of cells stained with FITC‐CD3, APC‐CD4, and PE‐CD8a antibodies, and gated on SSC/FSC. (b) Percentages of CD3+ CD8+, and CD3+ CD4+ cells. Data represent the mean ± standard error (n = 4 per group). (c) Western blot analysis showing the expression of the transcription factor GATA‐3 in the whole spleen (50 μg/lane), unstimulated CD4+ cells (28 μg/lane), and CD4+ cells stimulated with concanavalin A (28 μg/lane). CD4+ cells were isolated immunomagnetically, and the GATA‐3 level was quantified by densitometry and normalized to β‐actin level (n = 4 per group). *P < 0·05 versus standard; # P < 0·05 versus zinc‐deficient/IL‐4 i.p.; + P < 0·05 versus zinc‐deficient/standard by anova, followed by the Student–Newman–Keuls test. i.p., intraperitoneal; IL, interleukin; SSC/FSC, side scatter/forward scatter; GATA‐3, GATA‐binding protein 3; anova, analysis of variance.
