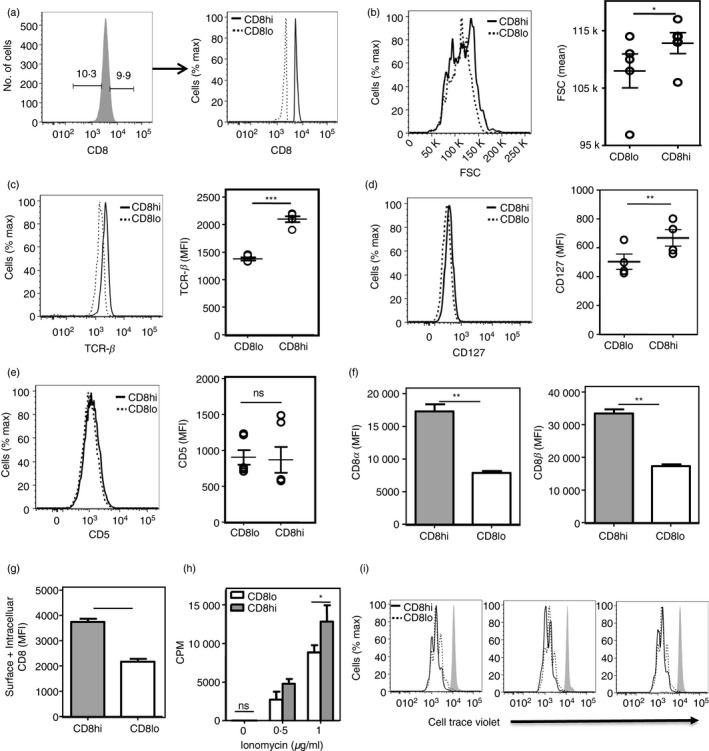
Figure 2.

Phenotypic differences between CD8hi and CD8lo naive CD8 T cells. (a) Strategy for gating naive (CD62Lhi CD44lo) CD8T cells into CD8hi‐ and CD8lo‐decile subsets. (b–e) Comparison of cell size (forward scatter; FSC; (b), and expression of T‐cell receptor‐β (TCR‐β) (c), CD127 [interleukin‐17 receptor α (IL‐7Rα)] (d) and CD5 (e) levels between naive CD8hi and naive CD8lo cells (n = 5). ***P < 0·001, **P < 0·01, *P < 0·05, ns, non‐significant; MFI, mean fluorescence intensity. (f) Levels of CD8α and CD8β on naive CD8 T cells gated into CD8hi‐ and CD8lo‐decile subsets based on CD8α expression. (g) Total (surface + intracellular) CD8 levels in CD8hi and CD8lo naive CD8 T cells (P <0·001). (h) [3H]Thymidine incorporation assay on CD8hi and CD8lo cells, stimulated using PMA (100 ng/ml) and titrating concentrations of ionomycin, for 60 hr. Mean ± SE of triplicate cultures (of three independent experiments). (i) Cell Trace Violet dilution by sort‐purified CD8hi and CD8lo naive CD8 T cells stimulated with PMA (100 ng/ml) and ionomycin (1 μg/ml) for 48 hr. Three plots represent data from three independent experiments
