-
A, B
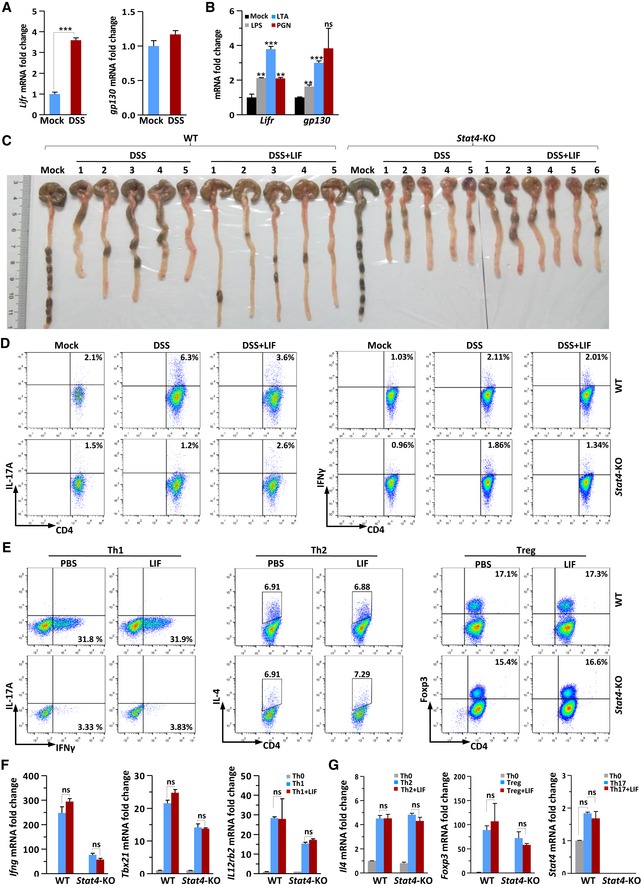
Quantitative expression of Lifr and gp130 mRNA in colon tissue from DSS‐challenged or control mice (n = 6 per group) (A) or in IECs following stimulation by LPS (2.5 μg/ml), PGN (3 μg/ml), or LTA (2 μg/ml) for 2 h (B).
-
C
Macroscopic changes in the colon of WT and Stat4‐KO mice on day 14 of colitis induction.
-
D
FACS staining of LPLs isolated on day 10 from the colon of WT and Stat4‐KO colitis mice receiving PBS or LIF (n = 4 per group). The percentage of IL‐17A+ (left) and IFNγ+CD4+ (right) T cells in vivo was analyzed.
-
E
FACS staining of WT and Stat4‐KO naïve CD4+ T cells treated or not treated with LIF on day 4 of induction into Th1‐, Th2‐, or Treg‐cell subsets.
-
F, G
qPCR analysis of Th1, Th2, or Treg signature gene expression in WT and Stat4‐KO naïve CD4+ T cells on day 4 of induction into the indicated subsets in the absence or presence of LIF. The data are representative of three independent experiments.
Data information: *
P < 0.05, **
P < 0.01, and ***
P < 0.001, ns: not significant (Student's
t‐test). Error bars represent the SEM.

