
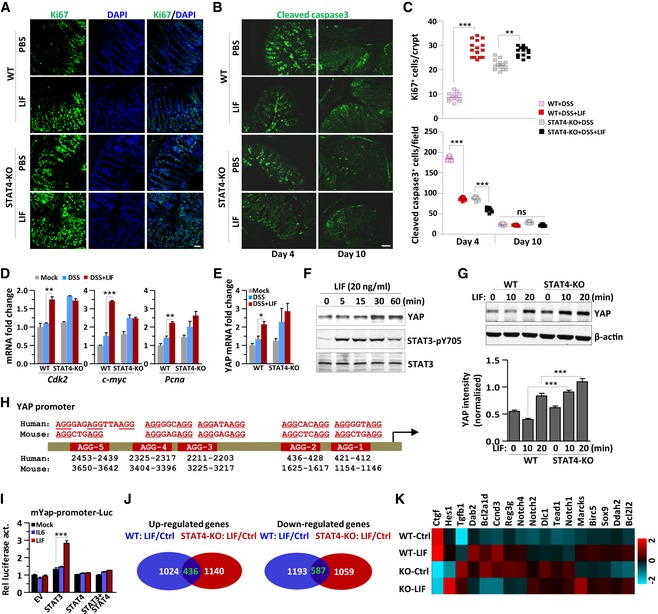
Figure 6. STAT3 is responsible for YAP gene expression and cell proliferation in the intestinal.
-
A–CKi67 and cleaved caspase 3 staining of representative colons obtained from mice on day 10 of colitis induction as described in Fig 2A. The number of proliferating cells per crypt in (A) (upper panel) or apoptotic cells per field in (B) was determined (n = 5 per group, 5 crypts were counted per mouse). Scale bar, 50 μm.
-
D, EQuantitative mRNA expression analysis of the indicated genes in colon tissues obtained from WT or Stat4‐KO colitis mice treated as described in Fig 2A (n = 3 per group).
-
FImmunoblot analysis of the expression and modification of the indicated proteins in DLD‐1 cells treated with LIF (20 ng/ml) for different durations.
-
GImmunoblot analysis of YAP expression in WT or Stat4‐KO IECs treated with LIF (20 ng/ml) for different durations; β‐actin was used as a loading control (top). The statistical analysis of YAP protein intensity is shown in the bottom panel. The data are representative of three experiments.
-
HThe human and mouse Yap promoter locus contains multiple AGG elements, as indicated.
-
IRelative YAP promoter‐luciferase reporter activities in HEK293T cells transfected with EV, STAT3, or STAT4 and then treated with IL‐6 or LIF for 8 h. The data are representative of three experiments.
-
J, KRNA sequencing analysis of the gene expression profile in IECs treated with or without LIF (50 ng/ml) for 6 h. Statistical analysis of the average fragments per kilobase of transcript per million mapped reads (J). Heatmap showing the expression profile of cell proliferation‐related genes in LIF‐treated or control IECs (Ctrl) (K).