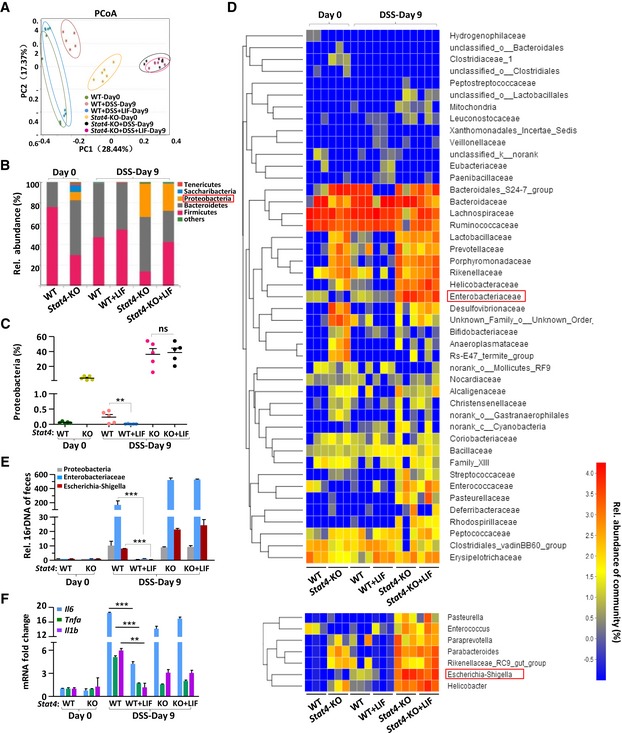
Figure 7. LIF treatment modulates the outgrowth of the proinflammatory microbiota during intestinal inflammation.

- Principal coordinate analysis (PCoA) of the microbiota composition determined by 16S rRNA gene sequencing of day 0 and day 9 fecal specimens from mice treated as described in Fig 5A (n = 5 or 6 per group). Each symbol represents an individual mouse. PC1 and PC2 represent principal components 1 and 2, respectively.
- The bars depict the average relative abundance of the bacterial phyla of the microbiota in fecal specimens, as determined by taxon‐based analyses as described in (A) (n = 5 per group).
- 16S rRNA sequencing analyses of the Proteobacteria distribution in feces from WT or Stat4‐KO colitis mice. (n = 5 per group).
- Heatmap depicting the relative abundance of microbes at the family level (top) and the genus level (bottom) in the fecal specimens described in (A) (n = 3 per group).
- qPCR of the 16S rRNA genes of microbes in the phylum Proteobacteria, family Enterobacteriaceae, and genera Escherichia‐Shigella in the feces of the indicated mice on day 0 and day 10 (n = 6 per group) of colitis induction.
- Quantitative mRNA expression analysis of proinflammatory genes in the colon of mice (n = 3 per group) treated as described in Fig 2A.
