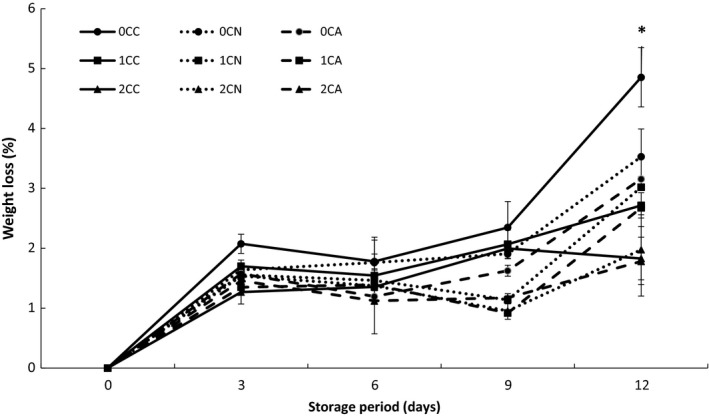
Figure 2.

Percentage loss in weight of fresh‐cut cucumber stored at 5°C for 12 days. Where 0C, 1C, and 2C represents 0%, 1%, and 2% chitosan concentration respectively, and C, N, and A represents control (air‐based), N (nitrogen‐based), and A (argon‐based) MAP, respectively. Values represent the mean ± SD of three determinations. “*” Indicates significant differences (p < 0.05) between treatments at the same storage day
