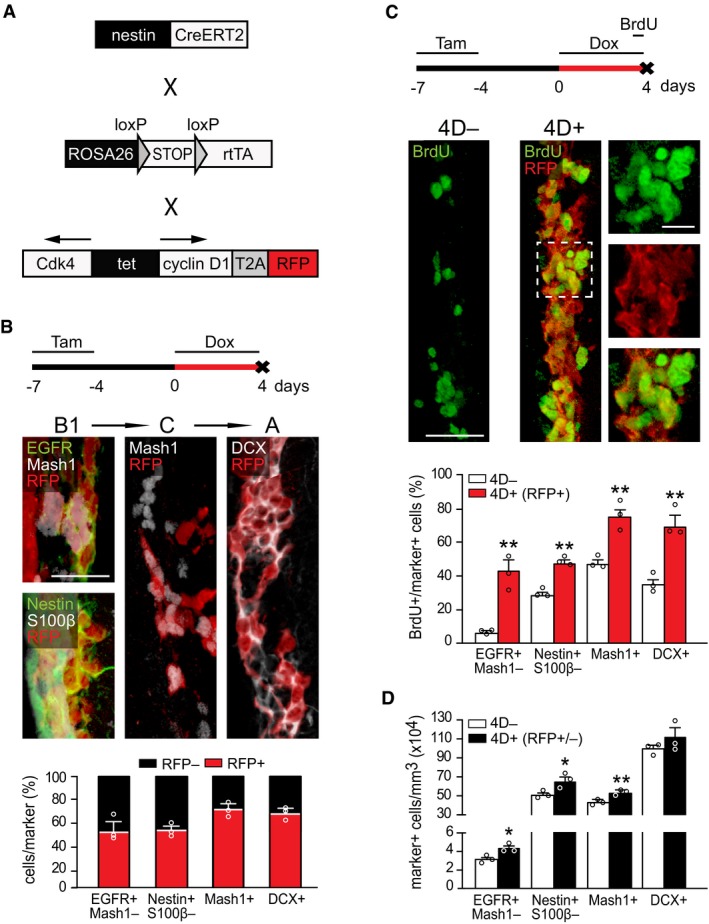
Drawings of the
nestin
CreERT2 (Imayoshi
et al,
2008),
ROSA26
rtTA‐flox (Belteki
et al,
2005), and
tet
4D‐RFP (Nonaka‐Kinoshita
et al,
2013) alleles of the 4D line.
From top to bottom: experimental design of 4D induction, fluorescence pictures of the SVZ of a 4D+ mouse and quantification of the proportion of RFP− (black) and RFP+ (red) progenitors among B1, C, and A cells identified with markers as indicated.
From top to bottom: experimental design, fluorescence pictures of the SVZ of a 4D− (left) and 4D+ (right and insets magnified) mice, and quantification of the proportion of BrdU+ among B1, C, and A cells (identified as in B). Note that in 4D+ mice quantification was restricted to the RFP+ subpopulation (red bars).
Quantification of the absolute number of B1, C, and A cells (identified as in B) in the SVZ of 4D− (white) and 4D+ (black) mice regardless of RFP expression (RFP+/−).
Data information: (B–D) Mean ± SEM; *
P <
0.05 and **
P <
0.01 calculated by unpaired Student's
t‐test;
N = 3 mice,
n > 423 cells for each quantification. Scale bar = 50 μm (B and C) or 20 μm (inset in C).

