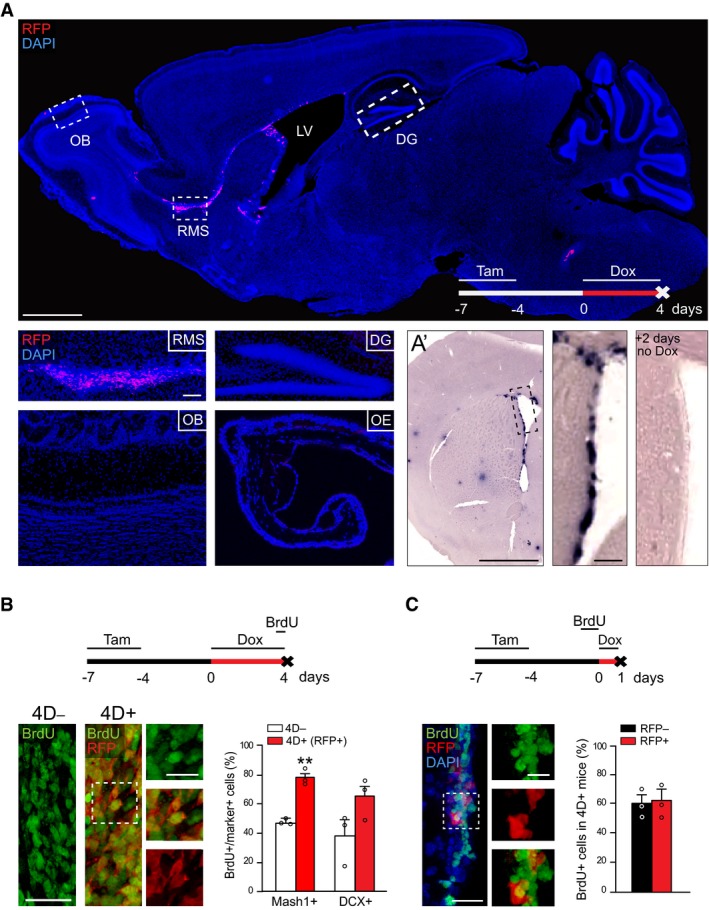
B, CExperimental design (top), fluorescence pictures (left with magnified insets), and quantifications (right) of BrdU incorporation in the RMS (B) or SVZ (C). (B) shows the proportion of BrdU in C (Mash1+) and A (DCX+) cells in 4D− (white) and 4D+ (red; among RFP+) mice. (C) shows the proportion of RFP− (black) and RFP+ (red) among BrdU+ cells of 4D+ mice. (A) OB, olfactory bulb; RMS, rostral migratory stream; LV, lateral ventricle; DG, dentate gyrus; OE, olfactory epithelium. (A–C) Tam, tamoxifen; Dox, doxycycline. (B, C) Mean ± SEM; **P < 0.01; unpaired Student's t‐test; N = 3 mice and n > 1,100 cells. Scale bars = 500 (A top, A’), 100 (insets A and A’), 50 (B and C), and 20 (insets B and C) μm.

