-
A
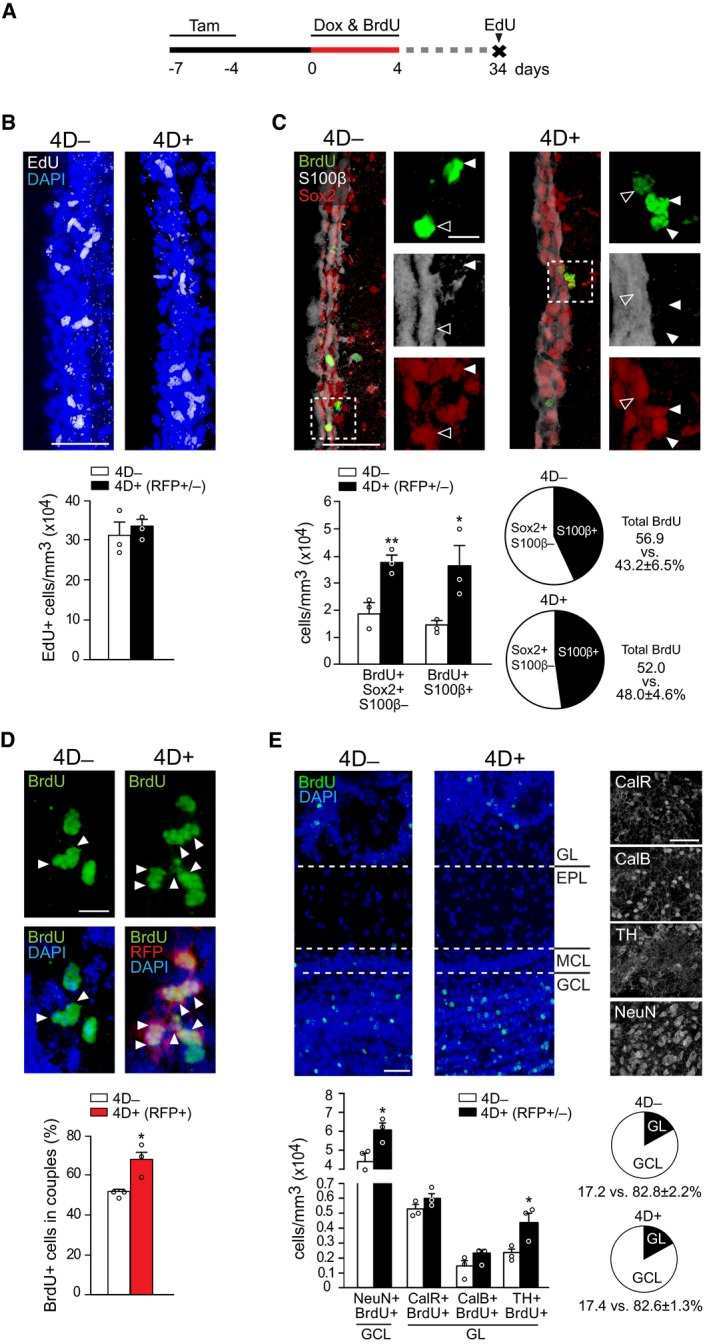
Experimental design used to assess the chronic effect of a transient 4D induction with BrdU and EdU given during Dox administration or 1 h before sacrifice, respectively.
-
B–E
From top to bottom: fluorescence pictures of the SVZ (B–D) or OB (E) and absolute number (B, C, and E) or proportions (C–E) of cells in 4D− (white bars) or 4D+ (black or red bars for all or RFP+ cells, respectively) mice scored positive for various markers as indicated. Insets in (C) are magnified (right) with arrowheads pointing label‐retaining NSC (white) or astrocytes (empty). Arrowheads in (D) point cell doublets (among RFP+ protein‐retaining cells in 4D+). (E) GL, glomerular; EPL, external plexiform; MCL, mitral cell and GCL, granule cell layers.
Data information: (B–E) Mean ± SEM; *
P <
0.05, **
P <
0.01 assessed by unpaired Student's
t‐test (bar graphs) or Fisher's exact test (pie graphs);
N = 3 mice,
n > 285 cells for each quantification. Scale bars = 50 μm (B, C, and E) and 20 μm (D and insets in C).

