-
A
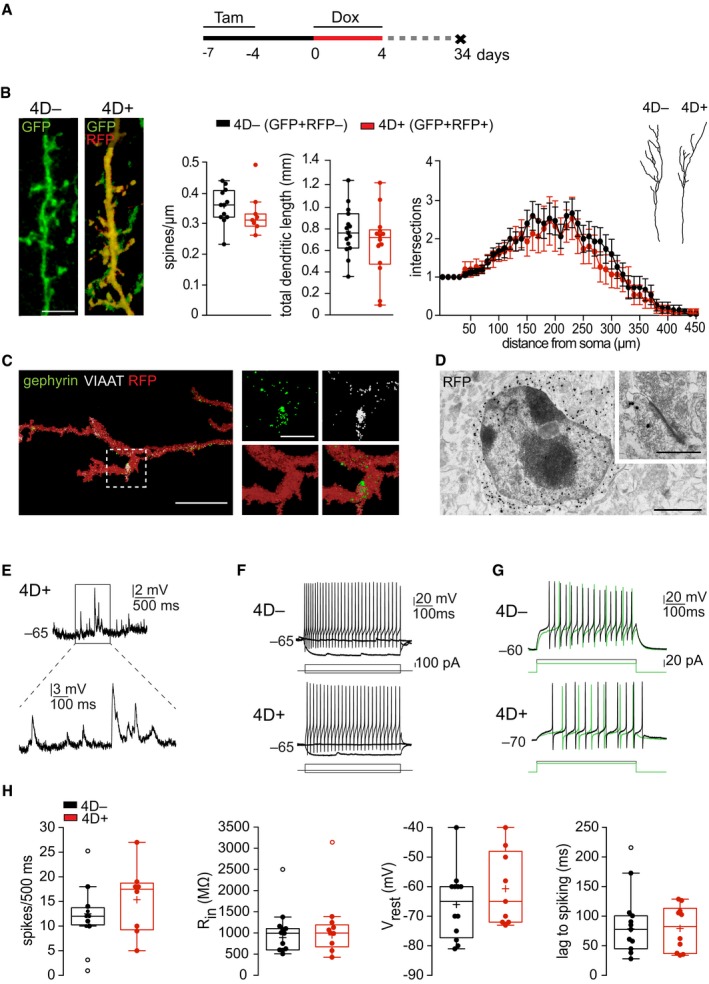
Experimental design to assess the integration of 4D‐derived neurons.
-
B
Fluorescence pictures (left) of immunolabeled GFP+RFP− (4D−) and GFP+RFP+ (4D+) apical dendrites of superficial granule neurons and quantifications (middle and right) of spine density and total dendritic length (box and whiskers) and 3D‐Sholl (line graph profile) of apical dendrites starting from the soma (drawings) as the mean number of intersections at 10‐μm intervals.
-
C
3D reconstruction of multi‐channel confocal stacks acquired from a RFP+ apical dendrite of a granule cell showing co‐localization with the pre‐ and post‐synaptic markers VIAAT (granule neuron) and gephyrin (mitral cell), respectively (magnification shown in insets).
-
D
Anti‐RFP immunogold labeling of a cell in the superficial granule cell layer of a 4D+ mouse. Inset shows a representative RFP+ synapse (out of > 10 analyzed from 4D+ mice).
-
E–G
Current clamp recordings showing examples of spontaneous barrages of synaptic potentials (E), and repetitive spiking in response to depolarizing current steps (F, G) of 4D− (top) and 4D+ (bottom) mice. Inset in E (4D+ cell) is magnified (bottom). Note in (G) that the lag preventing spike initiation is longer at lower currents (green) and shorter at higher (black), suggesting the presence of an A‐type K current typical of granule cells in 4D− vs. 4D+.
-
H
Box and whiskers plots representing electrophysiological properties of neurons derived from 4D
− and 4D
+ NSC (black and red, respectively) including from left to right: spike number, resting membrane potential (Vrest), input resistance (Rin), and lag to spiking of the recorded superficial granule cells (see Fig
EV3 for additional parameters).
Data information: Data are presented as mean ± SEM in the line graph in panel (B). No significant difference was found by unpaired Student's
t‐test (throughout) or repeated measures two‐way ANOVA (line graph in B). Boxplots in (B and H) show the median (horizontal line), and mean (+) and whiskers indicate the lowest and highest values within 1.5 interquartile range. Outliers were identified by Tukey's test. (B)
N = 3 mice,
n > 8 neurons per genotype; (E–H)
N > 5 mice,
n = 12 4D
− and 10 4D
+ neurons. Scale bars = 5 μm (B and C), 1 μm (D and insets in C), and 0.5 μm (inset in D).

