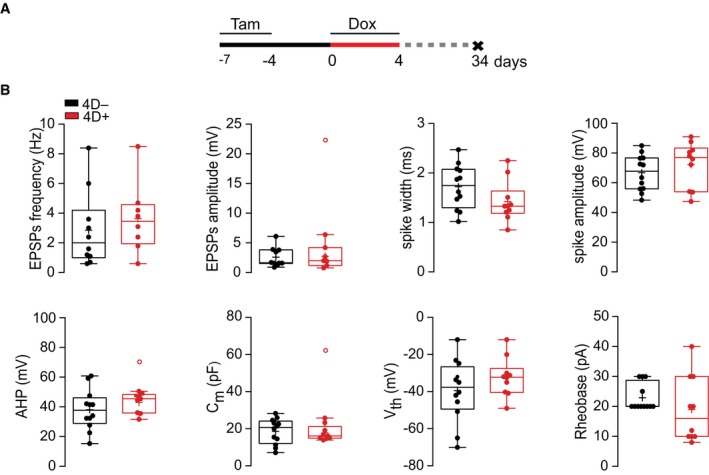
Box and whiskers plots extending the electrophysiological analyses of GFP
+/RFP
− (black) and GFP
+/RFP
+ (red) patched superficial granule neurons shown in Fig
3E–H. From left to right: frequency and amplitude of excitatory post‐synaptic potential (EPSP), spike width and amplitude (top) and after hyperpolarization (AHP), membrane capacitance (Cm), voltage threshold (Vth), and rheobase (bottom). Significance was calculated by unpaired Student's
t‐test and outliers identified by Tukey's test;
N > 5 mice,
n > 10–12 neurons. Scale bars = 10 μm.

