
Figure EV4. Performance and DTs at different discrimination tasks.
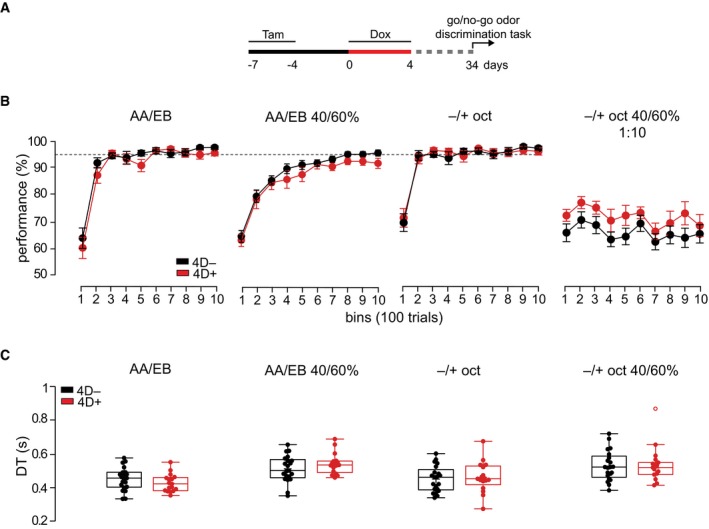
- Experimental design used to test effects on olfaction. Tam, tamoxifen; Dox, doxycycline.
- Line graphs indicating the proportion of correct responses (performance) for bins of 100 trials during testing with (from left to right): pure and binary mixture of AA vs. EB and pure and 1:10 diluted binary mixture of (−) vs. (+)‐octanols. Discontinuous line indicates the similar 95% plateau performance of 4D− (black) and 4D+ (red) mice.
- Box and whiskers plots representing the DTs calculated at 95% performance. Note that DTs are slower using the automated olfactometer compared with the previously used olfactometers owing to differences in odor port design (Abraham et al, 2010). (C) AA, amyl acetate; EB, ethyl butyrate; oct, octanol.