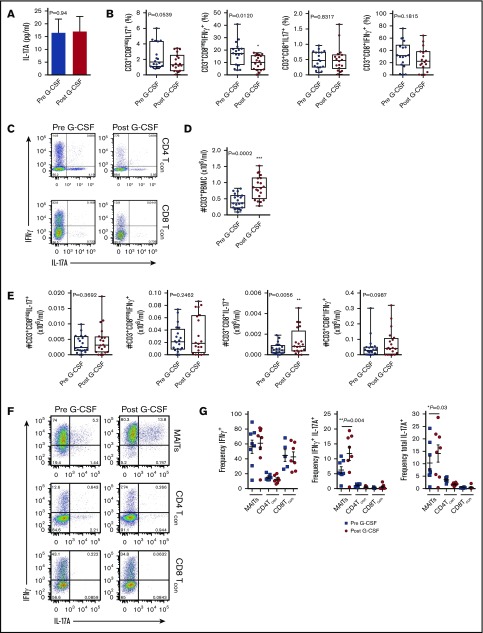
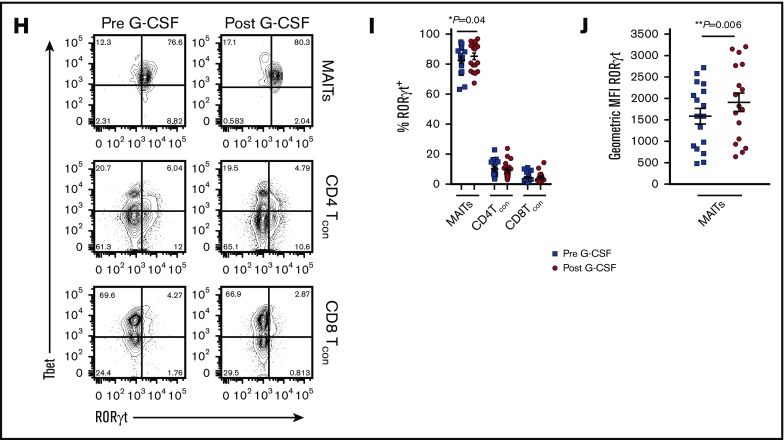
Figure 1.
Blood MAIT cells are modified by G-CSF mobilization. (A) Plasma IL-17A levels before and after G-CSF administration (n = 17 donors). (B-C) Frequency and representative FACS plots of Th17 (CD3+CD8negIL-17A+), Th1 (CD3+CD8negIFN-γ+), Tc17 (CD3+CD8+IL-17A+), and Tc1 (CD3+CD8+IFN-γ+) subsets in PBMCs (n = 15 donors). (D) Number of CD3+ T cells per milliliter PB (n = 20 donors); ***P = .0007. (E) Number of Th17 (CD3+CD8negIL-17A+), Th1 (CD3+CD8negIFN-γ+), Tc17 (CD3+CD8+IL-17A+), and Tc1 (CD3+CD8+IFN-γ+) subsets per milliliter PB (n = 15 donors); **P = .0079, Tc17 number before vs after G-CSF. Data were analyzed using the paired Wilcoxon signed rank test and are presented using box-and-whisker plots showing the median with 25th percentiles (whiskers represent minimum to maximum values). (F) Representative FACS plots depicting IFN-γ and IL-17 expression in sorted donor MAIT, CD4Tcon, and CD8Tcon populations stimulated ex vivo with phorbol 12-myristate 13-acetate/ionomycin. (G) Frequency of IFN-γ–, IFN-γ/IL-17A–, and total IL-17A–expressing MAIT, CD4Tcon, and CD8Tcon populations (n = 5-8 donors); **P=.004, frequency of IFN-γ/IL-17A–expressing MAIT cells before vs after G-CSF; *P=.03, frequency of total IL-17A–expressing MAIT cells before vs after G-CSF. (H) Representative FACS plots showing Tbet and RORγt expression by donor MAIT, CD4Tcon, and CD8Tcon populations in unfractionated PBMCs. (I) Frequency of RORγt-expressing MAIT, CD4Tcon, and CD8Tcon populations (n = 17 donors); *P = 0.04. (J) Geometric MFI of RORγt expression in donor MAIT cells; **P = 0.006. Data are presented as mean ± standard error of the mean.


