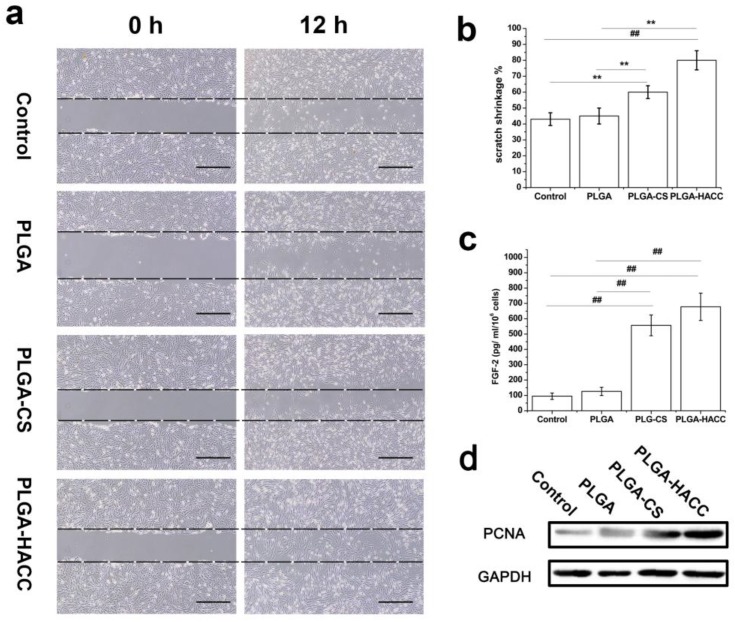
Figure 5.
Migration of HDFs cultured with different fibrous membrane extract solution (a); statistical analysis of HDFs migrations (b); FGF-2 production in HDFs 24 h after treatment as determined by ELISA (n = 5) (c); Western blotting of PCNA expression in dermal fibroblast proliferation (d); ## indicates p < 0.01, and ** indicates p < 0.05. The scale bar is 100 μm.

