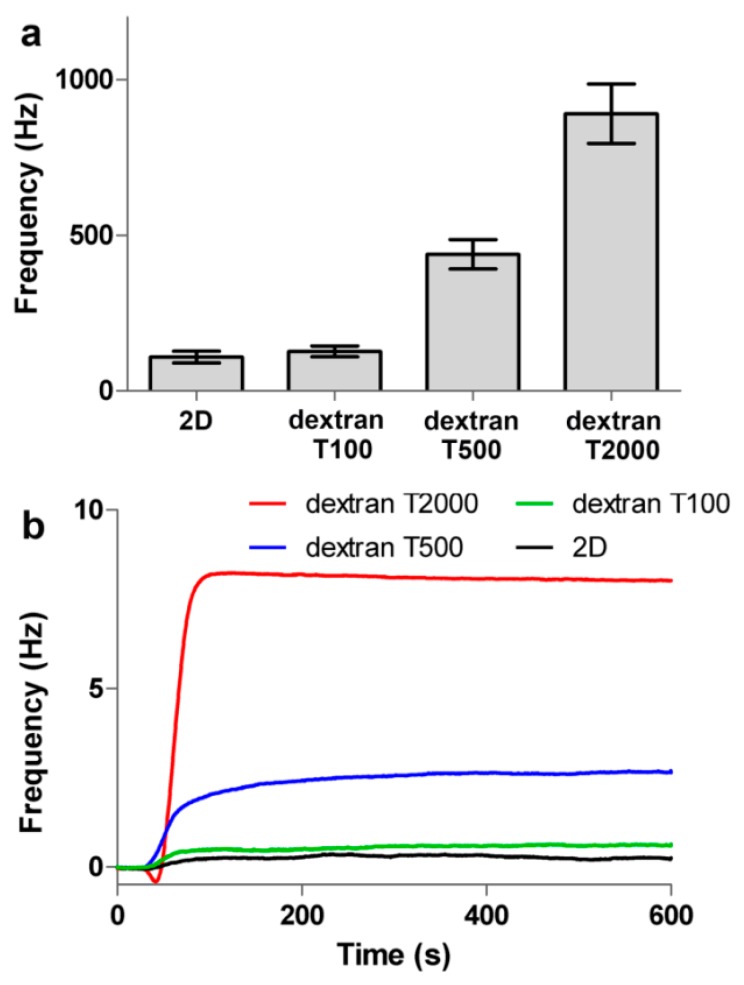
Figure 8.
(a) The frequency response of streptavidin immobilized onto different surfaces; (b) Comparison of the binding of biotinylated oligo on different surfaces, biotinylated oligo at a concentration of 10 μM was injected to the 2D and 3D surfaces, respectively. The measured responses on 3D carboxymethyl dextran (2000 kDa) surface are presented as a red line, and the measured responses on 3D carboxymethyl dextran (500 kDa) surface are shown as the blue line. All experiments were performed under the same conditions.

