Figure 4.
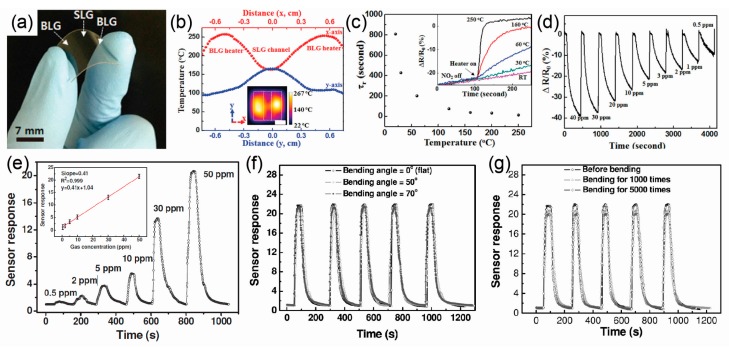
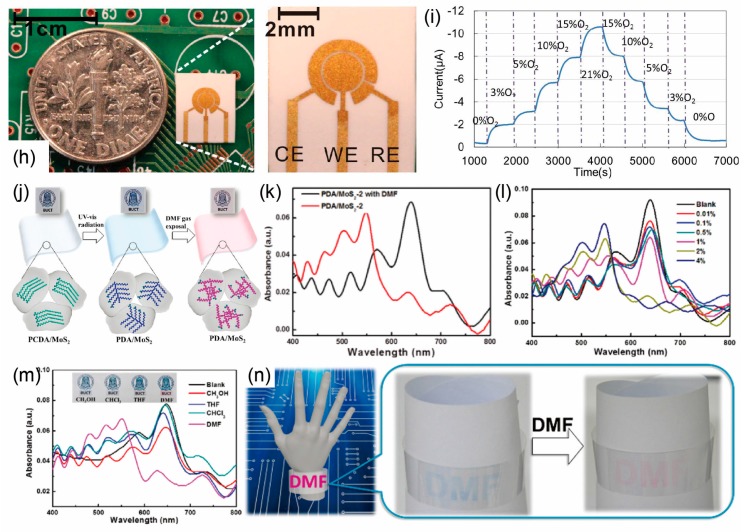
Wearable gas sensors and its integrated systems. (a) Photograph of transparent and flexible single-layer graphene (SLG) sensor channel-bilayer graphene (BLG) heater on a polyethersulfone (PES) substrate (scale bar 7 mm). (b)Temperature distribution along transverse (x-axis) and longitudinal (y-axis) direction of sensor-heater device structured as laterally intercalated SLG sensor channel (6 mm width) between BLG heaters (7 mm width) with applied 1.7 W of electric power. Here the red dot and blue dot are temperature profiles of thermal image in inset along x-axis and y-axis with origin at center on channel, respectively. Inset: Spatial temperature distribution of graphene heaters (7 mm width) which intercalate 6 mm width graphene sensor with applied 1.7 W. Here three broken squares indicate center channel and side heaters area, respectively (scale bar 7 mm). (c) Recovering time constant τr as a function of heater temperature. Inset: the recovering curves of the ΔR/R0 as a function of time under different temperature range from room temperature to 250 °C. (d) The relative resistance variation ΔR/R0 of SLG channels as a function of time including recovery step with 100 to 165 °C heating under different NO2 gas concentration from 40 to 0.5 ppm. Reprinted with permission from Ref. [37] Copyright 2014, John Wiley and Sons. (e) Response curves of the sensor to NO2 of different concentrations. Inset: The sensor response depends linearly on NO2 concentration. (f) Response curves of the sensor to 50 ppm of NO2 when tested under different bending angles. (g) Response curves of the sensor tested before and after bending 1000 and 5000 times (bending angle = 50°). Reprinted with permission from Ref. [114] Copyright 2014, John Wiley and Sons. (h) Photograph of microfabricated flexible room temperature ionic liquid (RTIL) based gas sensor (scale bars 1 cm and 2 mm, respectively). (i) Current versus time curve at various oxygen concentrations when the potential is held at −1.4 V vs. Au. Nitrogen is the background gas. Oxygen concentration steps up from 0% to 21% and steps down from 21% to 0%. Reprinted with permission from Ref. [117] Copyright 2013, IEEE. (j) Schematic illustration of the preparation of the PDA/MoS2 film and the sensor upon exposure to DMF vapor. (k) UV-vis spectra of polydiacetylene (PDA)/MoS2 composites with an increased ratio of MoS2 to PDA in the absence and presence of 0.1% DMF vapor. (l) UV-vis spectra of PDA/MoS2 films exposed to N,N-dimethylformamide (DMF) vapor with different concentrations. (m) UV-vis spectra of the PDA/MoS2 film upon exposure to different (5%) vapors, in comparison with 2% DMF vapor. (n) Flexible transparent wrist strap with DMF sensing ability. Reprinted with permission from Ref. [110] Copyright 2017, Royal Society of Chemistry.


