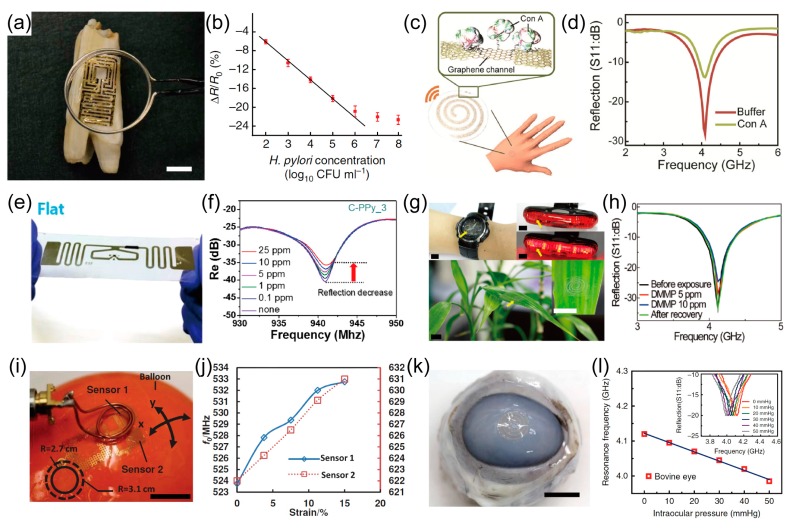
Figure 8.
Wearable sensors integrated with resonance antenna. (a) Optical image of the graphene-based wireless sensor transferred onto the surface of a tooth (scale bar: 1 cm). (b) graphene resistance change versus concentration of H. (a,b) Reproduced with permission from Ref. [159]. Copyright 2012, Nature Publishing Group; (c) Schematic of the biosensor attached to the skin on the back of a human hand; (d) Frequency response of the reflection coefficient of the antenna on the plastic substrates after buffer and Con A treatment. (c,d) Reproduced with permission from Ref. [12]. Copyright 2015, John Wiley and Sons; (e) Photographs of the RFID tag sensor; (f) Change in the reflectance properties. (e,f) Reproduced with permission from Ref. [163] Copyright 2016, American Chemical Society. (g) Optical photos of wearable gas sensors integrated with resonance antenna transferred onto various substrates (wristwatch, light of bicycle, and a leaf of live plant) (scale bars: 1 cm). (h) change in reflection coefficient (S11) of the wireless sensor on the leaf at varied DMMP vapor concentrations (before exposure, 5 ppm of DMMP, 10 ppm of DMMP, and after recovery). (g,h) Reproduced with permission from Ref. [18]. Copyright 2016, Royal Society of Chemistry. (i) Image of a wireless epidermal sensor attached onto the surface of a balloon to simulate measurement of lymphedema. Scale bar, 1 cm. (j) Change in resonance frequencies of strain sensors under the expansion of the balloon. (i,j) Reproduced with permission from Ref. [160]. Copyright 2014, John Wiley and Sons. (k) Photograph of the sensor transferred onto the contact lens worn by a bovine eyeball. Scale bar, 1 cm. (l) Frequency response of the intraocular pressure sensor on the bovine eye from 5 mmHg to 50 mmHg (Inset: the corresponding reflection coefficients of the sensor). (k,l) Reproduced with permission from Ref. [32]. Copyright 2017, Nature Publishing Group.

