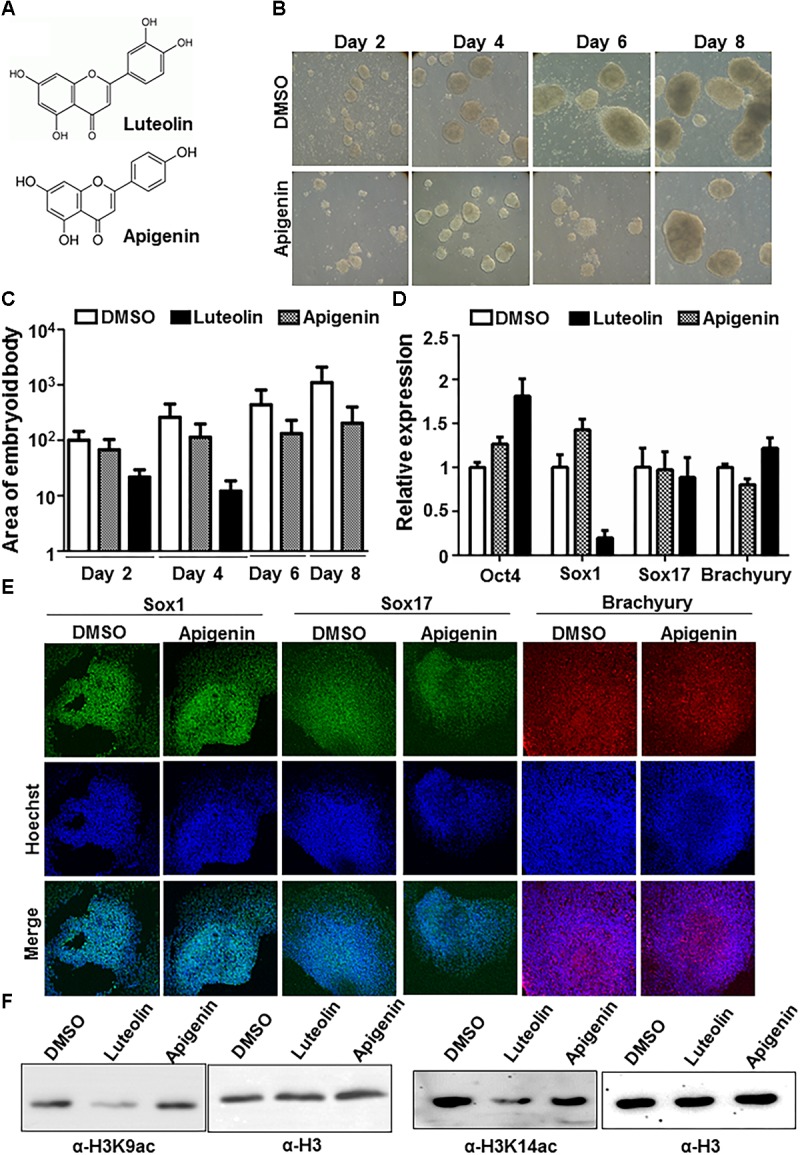
FIGURE 2.

Effect of luteolin on neuronal differentiation could be mediated by p300 inhibition. (A) Structure of luteolin and apigenin. Apigenin lacks the hydroxyl group that is critical for the p300-inhibitory potential of luteolin. (B) Bright-field images of EBs treated with apigenin acquired every alternate day show that apigenin treated control mESCs formed steadily growing EBs. (C) Quantification of (1A and 2B) showing the area of EBs from the 2D images acquired (arbitary units). Note that the scale is exponential (N = 2, n = 100 per sample per time point). One-way ANOVA with multiple comparisons shows significant increase of DMSO treated EB size from day 2 to day 8, with significant differences in EB size between DMSO and luteolin treated samples from day 4, but not on day 2. (D) qRT-PCR analysis of DMSO, luteolin or apigenin treated EBs for germline markers Sox1, Sox17, Brachyury, and stemness marker, Oct4. DMSO treated EBs were taken as control, GAPDH expression was used for normalization. N = 2, n = 3 per treatment (One way ANOVA with multiple comparisons for each gene shows significant differences between DMSO and luteolin treatment for Oct4 and Sox1 expression, with no difference between DMSO and apigenin). (E) Immunofluorescence analysis of germline marker expression in EBs treated with DMSO or apigenin for 24 h from 48 h. The expression of Sox1 (ectodermal marker), Sox17 (endodermal marker), and Brachyury (mesodermal marker) were analyzed. Scale bar: 50 μm. (N = 2, n = 3–5 EBs imaged per treatment per marker) (F) Immunoblotting of lysates extracted from E14Tg2a mESCs using antibodies against histone H3 lysine 9 acetylation, H3 lysine 14 acetylation, and H3. Treatment of mESCs with 15 μM luteolin results in a decrease in H3K9 and H3K14 acetylation in comparison to treatment with DMSO and apigenin treated cells.
