-
A
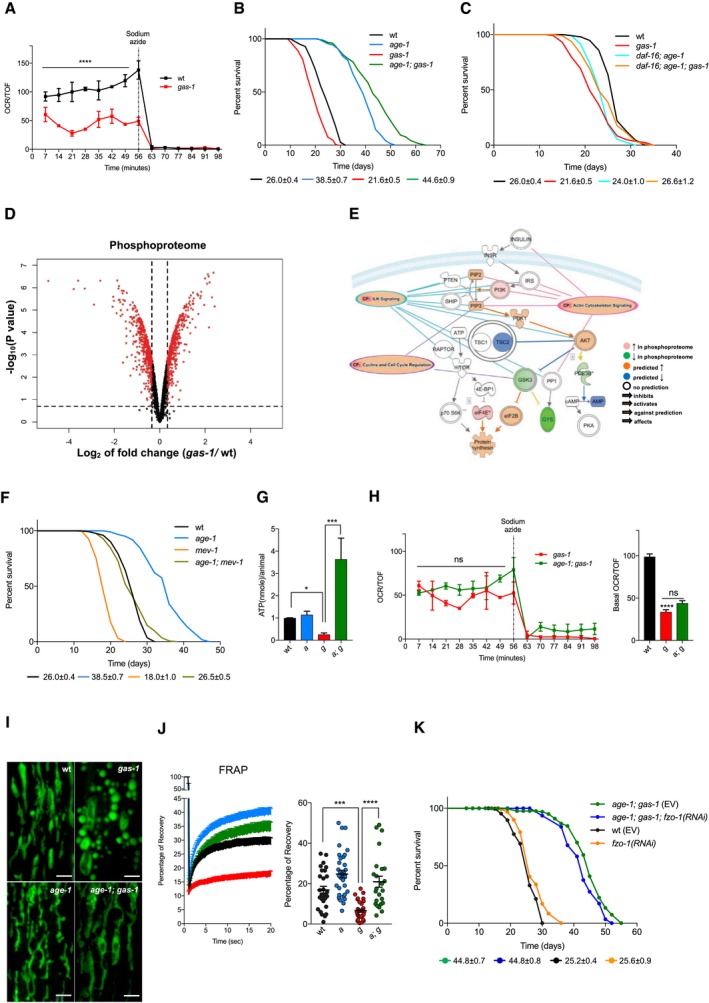
OCR of wt and gas‐1 mutant nematodes [normalized to nematode size as given by the COPAS Biosort (Time of Flight—TOF)]. One representative curve is shown (mean ± SEM; n = 3) ****P‐value < 0.0001; Kruskal–Wallis test, Dunn's post hoc correction.
-
B, C
Representative curves show the lifespan of wt and gas‐1(fc21) nematodes compared to (B) age‐1 and age‐1; gas‐1 mutants and (C) daf‐16 and daf‐16; age‐1; gas‐1 mutant animals. Average median lifespans ± SEM from all replicates indicated beneath representative curves.
-
D
Volcano plot of differentially phosphorylated proteins in gas‐1(fc21) mutants compared to wt. Cutoffs: 20% FDR and |log2(fold change)| > 0.345 (in red).
-
E
Schematic representation of IIS pathway including results and predictions from IPA of phosphoproteome of gas‐1(fc21) compared to wt. Shades of red and green are proportional to fold change, as calculated by IPA.
-
F
Lifespan analysis of mev‐1(kn1) nematodes compared to wt, age‐1(hx546), and age‐1(hx546); mev‐1(kn1) animals.
-
G
ATP measurements in wt, age‐1, gas‐1, and age‐1; gas‐1 mutant nematodes (normalized to wt), n = 4. Bars: mean ± SEM, *P‐value < 0.05, ***P‐value = 0.001, Kruskal–Wallis test, Dunn's post hoc correction.
-
H
OCR of gas‐1 and age‐1; gas‐1 mutant nematodes (normalized to TOF). Left panel: one representative curve (mean ± SEM). Right panel: basal respiration in wt, gas‐1, and age‐1; gas‐1 animals, pooled from three biological replicates, ****P‐value < 0.0001, ns = non‐significant, Kruskal–Wallis test, Dunn's post hoc correction.
-
I
STED images of representative mitochondrial morphology in muscle cells of L4 mutant worms. Scale bar: 2 μm.
-
J
Left panel: percentage of FRAP. Each point: mean recovery of ˜30 bleached regions (2 regions per animal, 15 animals per condition) ± SEM. Right panel: values of the maximum (total) recovery per strain ± SEM, ***P‐value < 0.001, ****P‐value < 0.0001, one‐way ANOVA, Tukey's post hoc correction.
-
K
Representative lifespan of age‐1; gas‐1 nematodes fed with empty vector (EV) and fzo‐1 RNAi bacteria. Average median lifespans ± SEM from all replicates indicated beneath representative curves. For all panels: wt = wild type, a = age‐1, g = gas‐1, a; g = age‐1; gas‐1.

