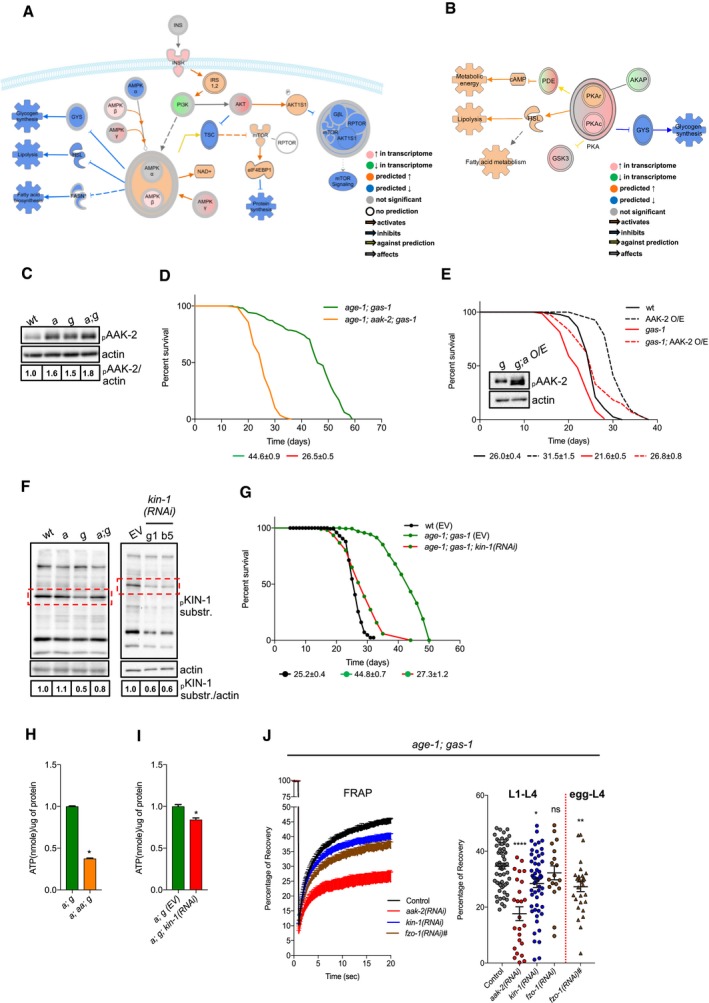
Figure 3. Increased AMPK/AAK‐2 and PKA/KIN‐1/2 activity occur in the long‐lived age‐1; gas‐1 mutants.

-
A, BSchematic representation with overlaid Molecule Activity Predictor (MAP) analysis of (A) AAK‐2/AMPK‐ and (B) KIN‐1/PKA‐regulated metabolic processes in age‐1; gas‐1 versus gas‐1 mutants. Color intensity corresponds to effect intensity or prediction strength.
-
CImmunoblot analysis of phospho‐AAK‐2 in wt, age‐1, gas‐1, and age‐1; gas‐1 mutant nematodes (actin loading control). Numbers correspond to band densitometries across three biological replicates.
-
DRepresentative lifespan of age‐1; gas‐1 double mutant and age‐1; aak‐2; gas‐1 triple mutant nematodes with average median lifespans ± SEM from all replicates indicated beneath representative curves.
-
ELifespan assay of gas‐1 mutant animals compared to gas‐1; AAK‐2‐overexpressing (O/E) nematodes and their wt counterparts. Inset: immunoblot analysis of phospho‐AAK‐2 in gas‐1 (g) and gas‐1; AAK‐2 O/E (g; a O/E) animals (actin loading control), showing the overexpressed protein (lower band) and the endogenous one (upper band).
-
FLeft panel: immunoblot analysis of phospho‐KIN‐1 substrates in young adult nematodes. Numbers correspond to band densitometries across two biological replicates. Right panel: immunoblot analysis of phospho‐KIN‐1 substrates in age‐1; gas‐1 animals grown on bacteria carrying an empty vector (EV) or expressing kin‐1 RNAi. Two different kin‐1 RNAi clones (g1, b5) were used in this experiment. Numbers correspond to band densitometries of the presented immunoblot. Dashed rectangles: band corresponding to downregulated KIN‐1 phospho‐substrate.
-
GRepresentative lifespan assay of wt and age‐1; gas‐1 nematodes fed with empty vector (EV) and kin‐1 RNAi bacteria with average median lifespans ± SEM from all replicates indicated beneath representative curves.
-
H, IATP measurements in: (H) age‐1(hx546); gas‐1(fc21) (a; g) and age‐1(hx546); aak‐2(ok524); gas‐1(fc21) (a; aa; g) mutant nematodes; (I) age‐1; gas‐1 (EV) (a; g (EV)) and age‐1; gas‐1; kin‐1 (RNAi) (a; g; kin‐1(RNAi)). Bars: mean ± SEM, n = 4, *P‐value < 0.05, Mann–Whitney U‐test.
-
JLeft panel: curves represent FRAP in age‐1; gas‐1 animals grown on RNAi from larval L1 (or from egg for fzo‐1 RNAi) to L4 stage. Each point: mean recovery of bleached regions (2–5 regions per animal, 10–20 animals per condition) ± SEM. Right panel: maximum (total) recovery per condition are shown, ±SEM. *P‐value < 0.05, **P‐value < 0.01, ****P‐value < 0.0001, Kruskal–Wallis test, Dunn's post hoc correction. For all lifespan curves, the legend shows average median lifespan ± SEM across all biological replicates.
Source data are available online for this figure.
