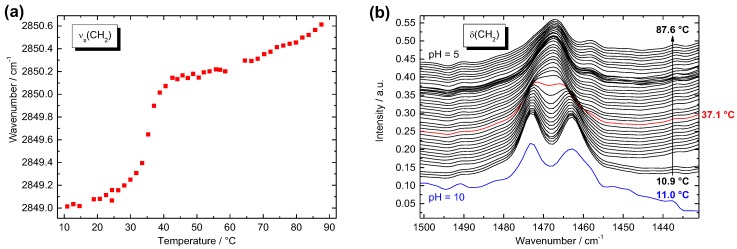
Figure 6.
Fourier transform infrared (FTIR) spectroscopy data of Me2PE-Gly(2C16)C32-OH (c = 100 mg mL−1 in acetate buffer, pH = 5, 300 mM): (a) wavenumber of the symmetric methylene stretching vibrational band as a function of temperature; and (b) FTIR spectra at different temperatures in the region of the methylene scissoring vibrational band; in black: heating from 10.9 °C (bottom) to 87.6 °C (top) in acetate buffer at pH = 5.0 with increments of 2 K (the red curve at 37.1 °C indicates a change in the band positions); in blue: FTIR spectrum in carbonate buffer at pH = 10 at 11.0 °C. The individual curves are shifted vertically for clarity.

